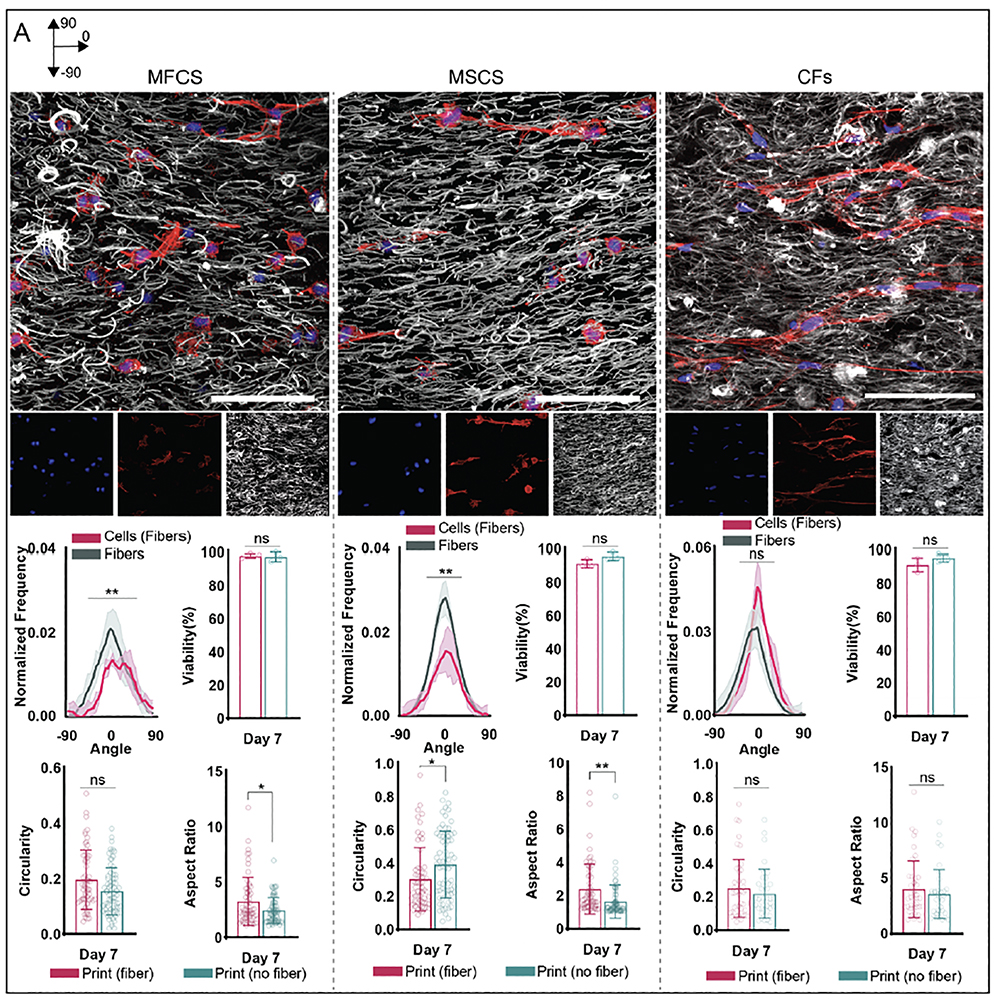
Figure 7:
Fiber and cell (MFC, MSC, CF) orientation within printed constructs from 5% GelMA bioinks with fibers. (Top) Representative schematics and images of constructs with fibers (grey) and cells (MFCs: left, MSCs: middle, CFs: right) (F-actin: red, cell nuclei: blue) for printed constructs 7 days after culture (30 μm z-stacks, scale bars 0.1 mm). (Bottom) Quantification of fiber and cell alignment along printed filament direction 7 days after culture (n=3 for each group, mean ± s.d., Watson two-sample test of homogeneity **p ≤ 0.01). Quantification of cell viability (analyzed with Hoechst 3342 and ethidium-homodimer 1 staining), aspect ratio, and circularity 7 days after culture for printed constructs. MFCS: n = 61 (Fiber Print), 73 (No Fiber Print) cells; MSCs: n = 62 (Fiber Print), 63 (No Fiber Print) cells; CFs: n = 44 (Fiber Print), 39 (No Fiber Print) cells; 3 biologically independent experiments, mean ± s.d., two-way ANOVA with Bonferroni post hoc *p≤ 0.05, ** p≤ 0.01, ***p ≤ 0.001, ****p ≤ 0.0001, ns = not significant).

