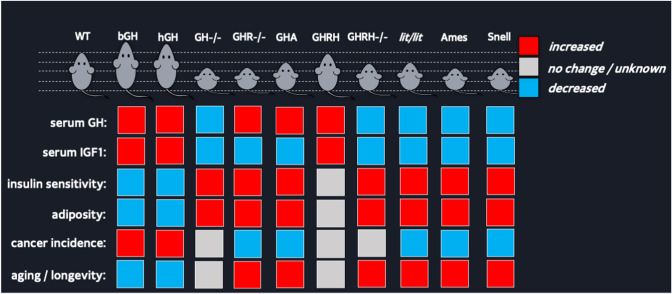
Fig. 2.
Phenotypic comparison among several transgenic and knockout mouse lines with altered GH action. The mice compared are depicted at the top of the figure along with their relative size and the altered genes. The red box indicates increased growth, the blue box indicates decreased growth, and the grey box indicates no change in growth relative to WT controls (Color figure online)

