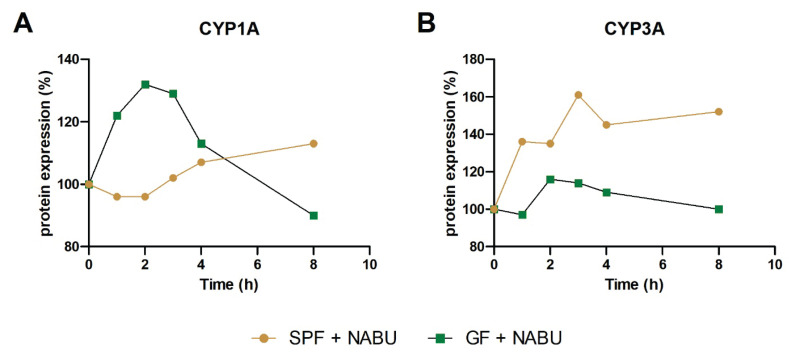
Fig. 5.
The protein expression of CYP1A (A) and CYP3A (B) in the liver of SPF and GF mice treated with nabumetone in time after one dose application in comparison with their SPF/GF control group (100 %) without nabumetone treatment. Protein relative levels were measured in the pooled microsomal fractions (3 animals per group).

