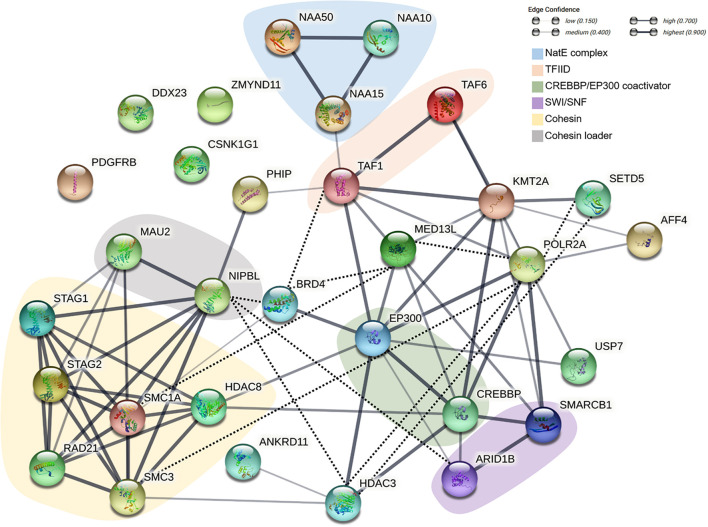
FIGURE 1.
Schematic representation of the functional and physical interactions of the chromatinopathies protein network. The network was generated with the String Database (v. 11.5) (Szklarczyk et al., 2019). Empty nodes represent proteins of unknown 3D structure, while filled nodes indicate proteins with known or predicted protein structure. Line thickness indicates the strength of data support. Interactions were established based on co-expression or data from either curated databases or experimentally determined. The network was subsequently manually curated (dotted black line) based on more recent literature.

