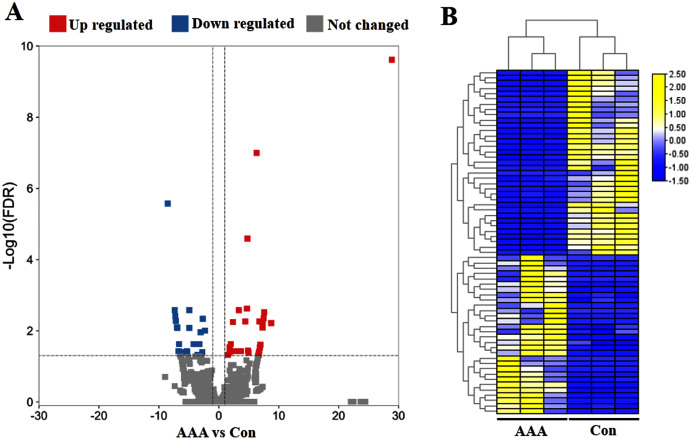
Figure 1. Analysis of differentially expressed circRNAs (DEcircRNAs).
(A) Volcano plots of circRNAs in abdominal aortic aneurysm (AAA) tissues from patients (N = 3) and abdominal aortic tissues from healthy subjects (N = 3) (normal tissues). The red and blue circle represent up- and down-regulated DEcircRNAs (|log2 fold change| ≥ 1 and p value < 0.05), respectively. (B) Heatmap of DEcircRNAs in AAA tissues and normal tissues. The high to low expression levels were represented as red to green. AAA: AAA group. Con: control group (normal tissues).

