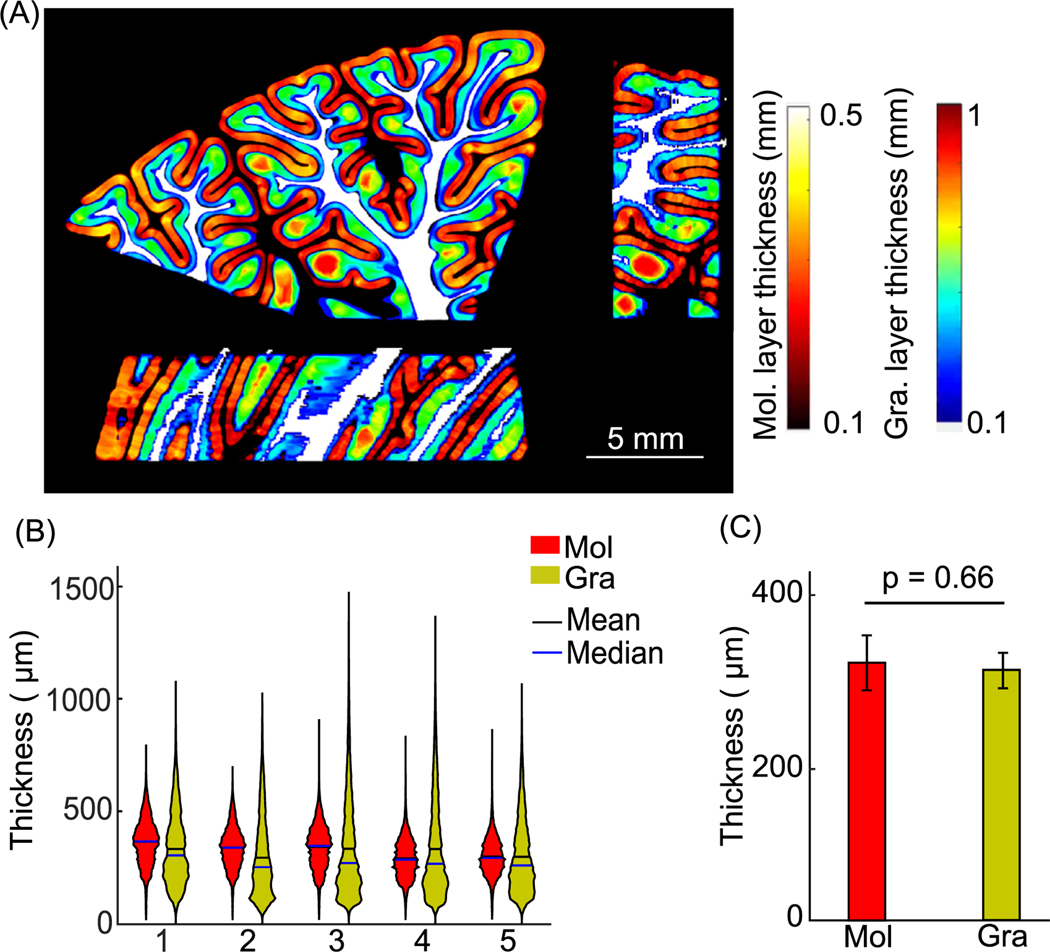
Fig. 5.
Cortical layer thickness in five cerebellar samples. (A) Molecular and granular layer thickness estimation in orthogonal views. The molecular and granular layer thicknesses are indicated by the hot and jet color bars, respectively. White matter is shown in white for anatomical reference. Scale bar: 5 mm. (B) Violin plots of molecular and granular layer thickness in individual subjects. The width and height of the violin plots correspond to the frequency and the value of thickness measurements. The mean and median of the measurements are also shown in the plots as black and blue solid lines. (C) Average cortical layer thickness of the five subjects (p = 0.66, paired-sample t-test). Error bars indicate standard deviations. Mol: molecular layer; Gra: granular layer.

