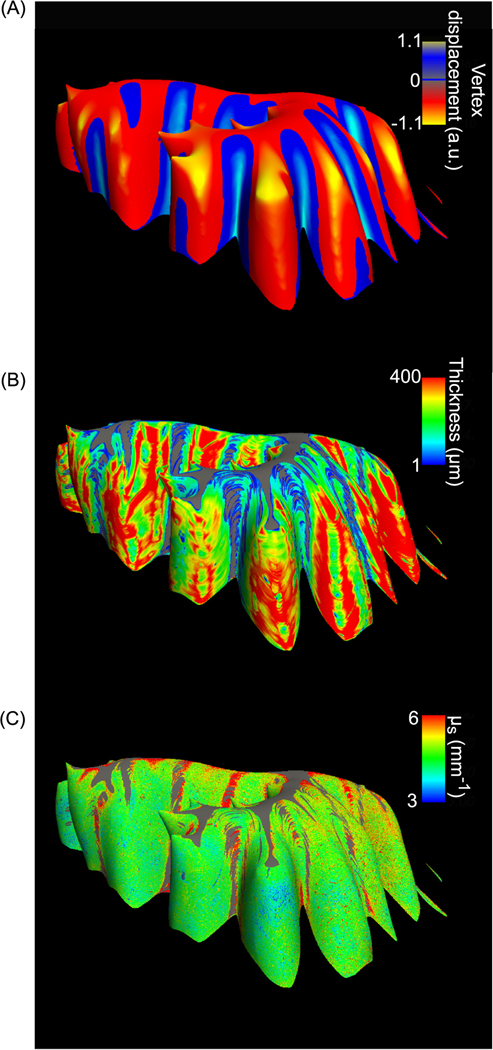
Fig. 7.
Surface mapping of the granular layer. The vertex displacement map on the inflated surface indicates the crown of folium (red) and depth of fissure (blue) (A), surface maps of layer thickness (B), and optical properties (C) of the subject shown in Fig. 2 and Fig. 3. Color bars in (A)-(C) indicate the vertex displacement from the original surface to the inflated one, layer thickness and μs values, respectively, along the surface normal at a depth of 150 μm below the outer surface. Gray regions in (B) and (C) are masked out from the surface map (A).

