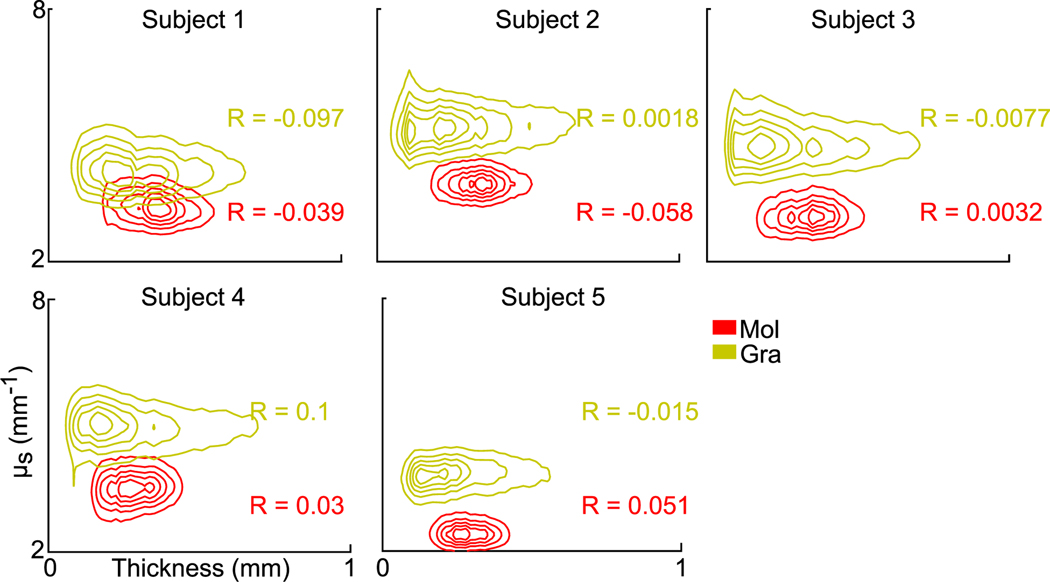
Fig. 9.
Contour plots of 2D distribution between thickness and μs measurements in the molecular and granular layers of five cerebellar samples. The correlation coefficients (R) between layer thickness and μs are shown for each subject in molecular and granular layers. Mol: molecular layer; Gra: granular layer.

