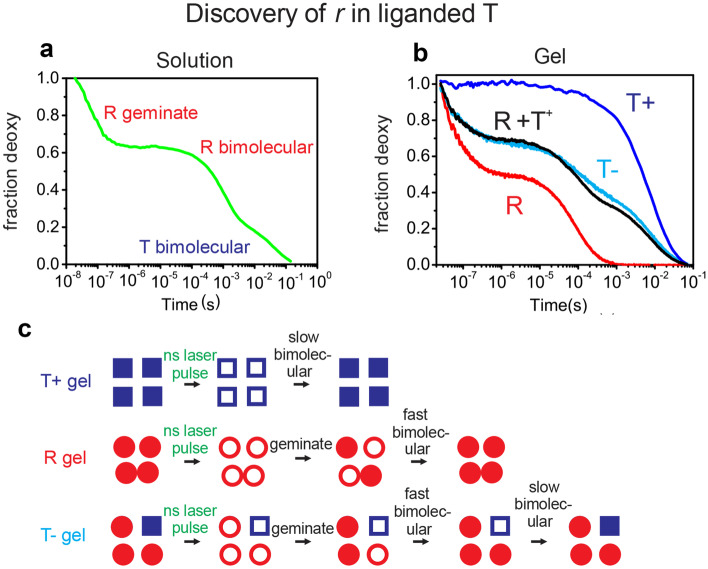
Fig. 10.
Results and explanation of CO nanosecond photolysis experiments of hemoglobin encapsulated in silica gels [55]. (a) three phases of CO rebinding following photodissociation of hemoglobin CO complex in solution. (b) CO rebinding kinetics following photodissociation of the R and T conformations encapsulated in silica gels saturated with allosteric effectors (T + , blue curve) and with no allosteric effectors (T-, cyan curve). The geminate rebinding amplitude in R is larger in the gel than in solution because there is no tertiary relaxation (r* to r) on the sub-second time scale in the gel to slow geminate rebinding. The fraction of r subunits in T- shown in panel c is obtained from the optimal linear combination of R and T + (black curve). (c) Explanation in terms of TTS model. Blue squares correspond to the t tertiary conformation, unfilled squares for unliganded and filled squares for liganded. Red circles correspond to the r tertiary conformation, unfilled circles for unliganded and filled circles for liganded

