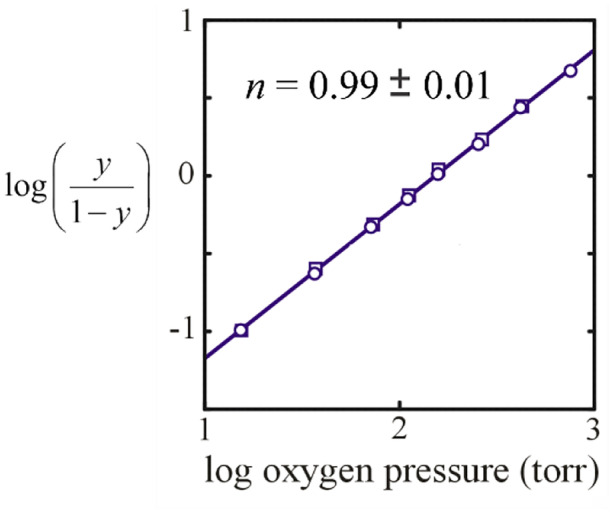
Fig. 7.

Hill plots of data for light polarized parallel to the a crystal axis showing that binding of the T conformation is non cooperative [47]. A slope of 1.0 in this kind of plot indicates no cooperativity. The slope for hemoglobin in solution is 2.8, indicating high cooperativity; the maximum value possible is the number of subunits, 4. The circles correspond to increasing oxygen pressure and the squares to decreasing oxygen pressure indicating that binding is at equilibrium. The line through the data is the least squares fits
