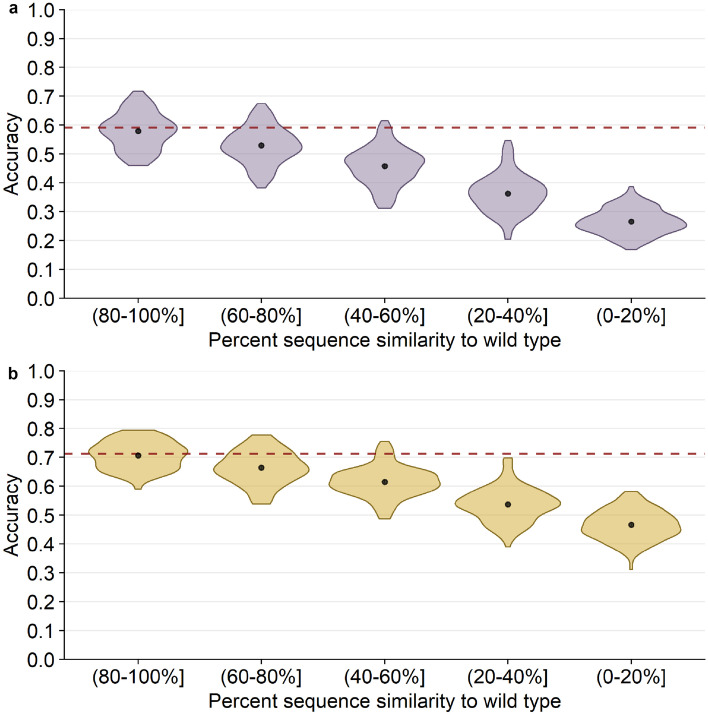
Fig. 3.
20 Å box CNN predictions of alignment consensus by alignment similarity. The black points and bars represent the means and 95% confidence intervals, respectively. If no bars are visible, the 95% confidence intervals are smaller than the points indicating the location of the means. The percent similarity is the similarity of each alignment sequence to the wild-type sequence, the structure of which is used to generate predictions. (a) Percent accuracy of predicting the alignment consensus amino acid. The red dashed line shows the mean accuracy of predicting the wild-type residue for comparison (59.2%). (b) Percent accuracy of predicting the alignment consensus class. The red dashed line shows the mean accuracy of predicting the wild-type class for comparison (71%)

