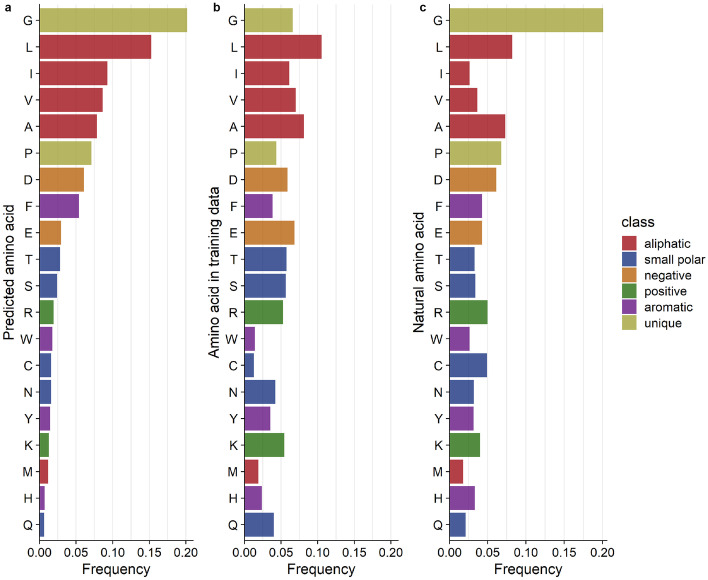
Fig. 5.
Distributions of amino acid types across predicted, training, and natural datasets. (a) The relative frequency of each amino acid predicted with a confidence of 80–100%. (b) The relative frequency of each amino acid type in the CNN training data. The correlation between predicted and training frequencies was 0.658 () (c) The distribution of highly conserved amino acids. These amino acids are found at frequencies at individual positions in the MSA. The correlation between predicted and conserved amino acid frequencies was 0.826 ()

