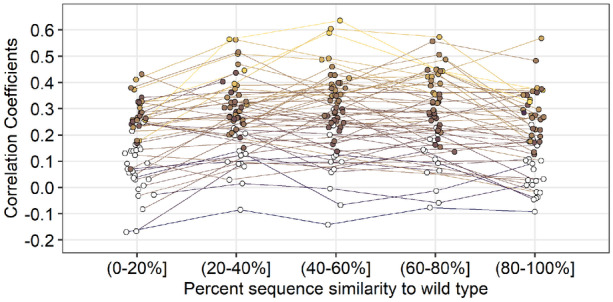
Fig. 7.

Comparing site-specific variability between CNN predictions and alignments as a function of percent similarity to the wild type. Predictions were generated by the 20 Å box CNN. Variability was calculated as the effective number of amino acids per site (). Each point represents the correlation coefficient between site-specific predicted variability () and alignment variability for a single protein. Colored points represent significant correlations (). All p-values have been adjusted with the false discovery rate correction. Average significant correlations per similarity group from lowest similarity to highest are 0.270, 0.330, 0.338, 0.335, and 0.286. No significant difference in mean correlation was found between the middle three similarity groups. However, there is a significant increase in mean correlation from the (0–20%] group to the (20–40%] group () and a significant decrease in mean correlation from the (60–80%] group to the (80–100%] group ()
