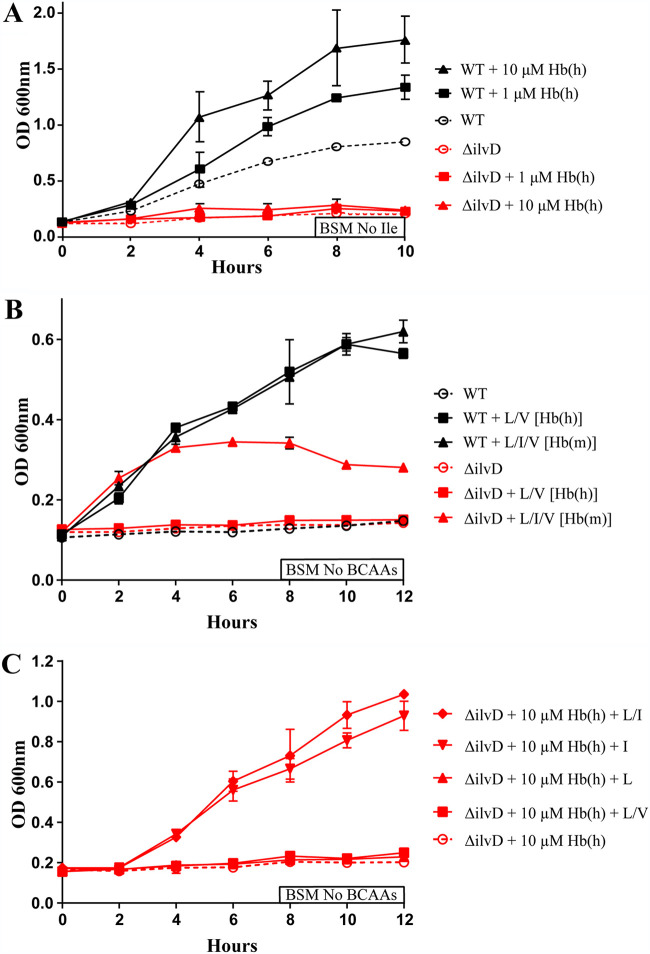
FIG 3.
The relationship between hemoglobin and BCAAs for the growth of ΔilvD B. anthracis. (A) Growth curve of WT and ΔilvD B. anthracis in BSM No Ile, supplemented with a gradient of Hb(h): 1 to 10 μM. (B) WT and ΔilvD B. anthracis in BSM No BCAAs, supplemented with BCAAs in molar equivalency to 10 μM either Hb(h) or Hb(m). (C) ΔilvD B. anthracis in BSM No BCAAs, supplemented with 10 μM Hb(h) and 3 mM BCAAs divided equally between I, L, L and V, or L and I. Error bars on all graphs represent the standard deviations in optical density, at 600 nm, between replicates at each time point.

