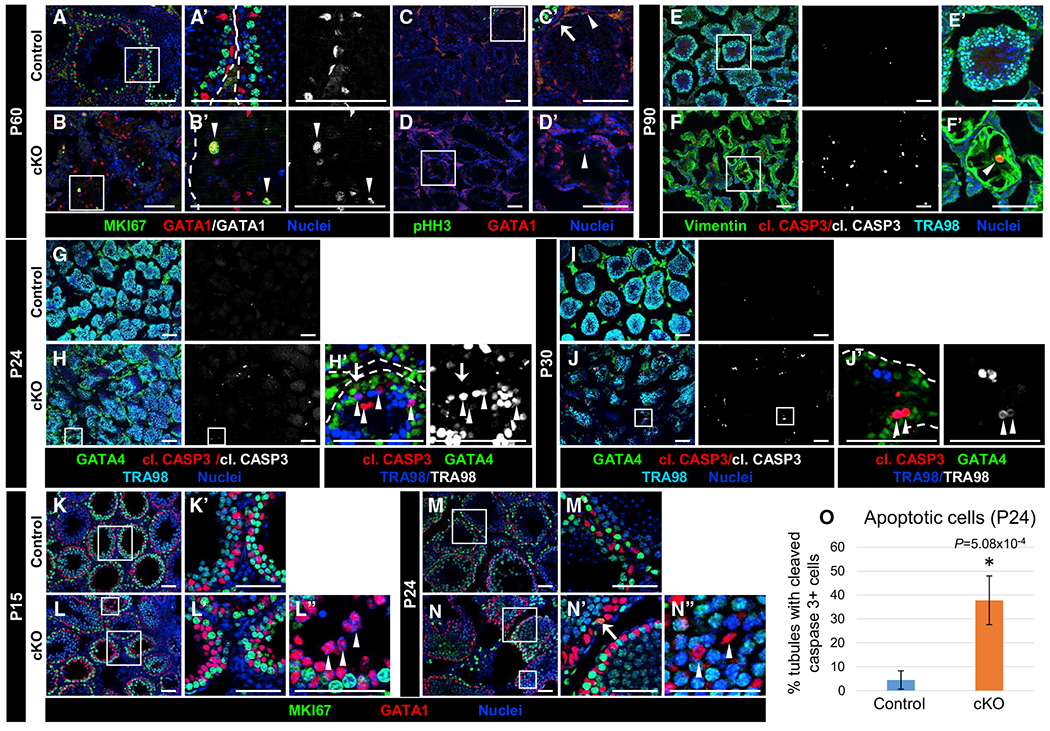
Figure 4. Cdc42 is not required for onset and maintenance of Sertoli cell quiescence but is required for Sertoli cell survival.

Immunofluorescent images of P60 (A–D), P90 (E and F), P24 (G, H, M, and N), P30 (I and J), and P15 (K and L) control Dhh-Cre;Cdc42flox/+ (A, C, E, G, I, K, and M) and cKO (B, D, F, H, J, L, and N) testes. (A’)–(F’), (H’), (J’), and (K’)–(N”) are higher-magnification images of the boxed regions in (A)–(F), (H), (J), and (K)–(N). Dashed lines throughout the figure indicate tubule boundaries.
(A and B) Both P60 control (A) and cKO (B) Sertoli cells are MKI67−, but rare cKO Sertoli cells expressing MKI67 (arrowheads in B’) are observed.
(C and D) Neither control (C) or cKO (D) Sertoli cells express the mitotic marker pHH3 (arrowheads in C’ and D’); only germ cells in control tubules are pHH3+ (arrow in C’).
(E and F) Cleaved caspase 3+ (apoptotic) Sertoli cells are rarely detected in P90 control (E) testes but are often observed in cKO (F) testes (arrowhead in F’).
(G–J) Compared to control P24 (G) and P30 (I) juvenile testes, cKO juvenile testes (H and J) exhibit increased cleaved caspase 3+ Sertoli cells (GATA1+; arrow in H’) and germ cells (TRA98+; arrowheads in H’ and J’).
(K–N) Relative to control P15 (K) and P24 (M) juvenile Sertoli cells, cKO juvenile Sertoli cells (L and N) show similar immunonegativity for MKI67 (arrowheads in L” and N”), apart from rare MKI67+ cells (arrow in N’). Scale bars, 100 μm.
(O) Graph showing percentage of tubules containing cleaved caspase 3+ cells in P24 control versus cKO testes (n = 15 tubules each from 3 testes each for controls and cKO). Data are shown as means ± SDs. p value was calculated via a 2-tailed Student’s t test.
