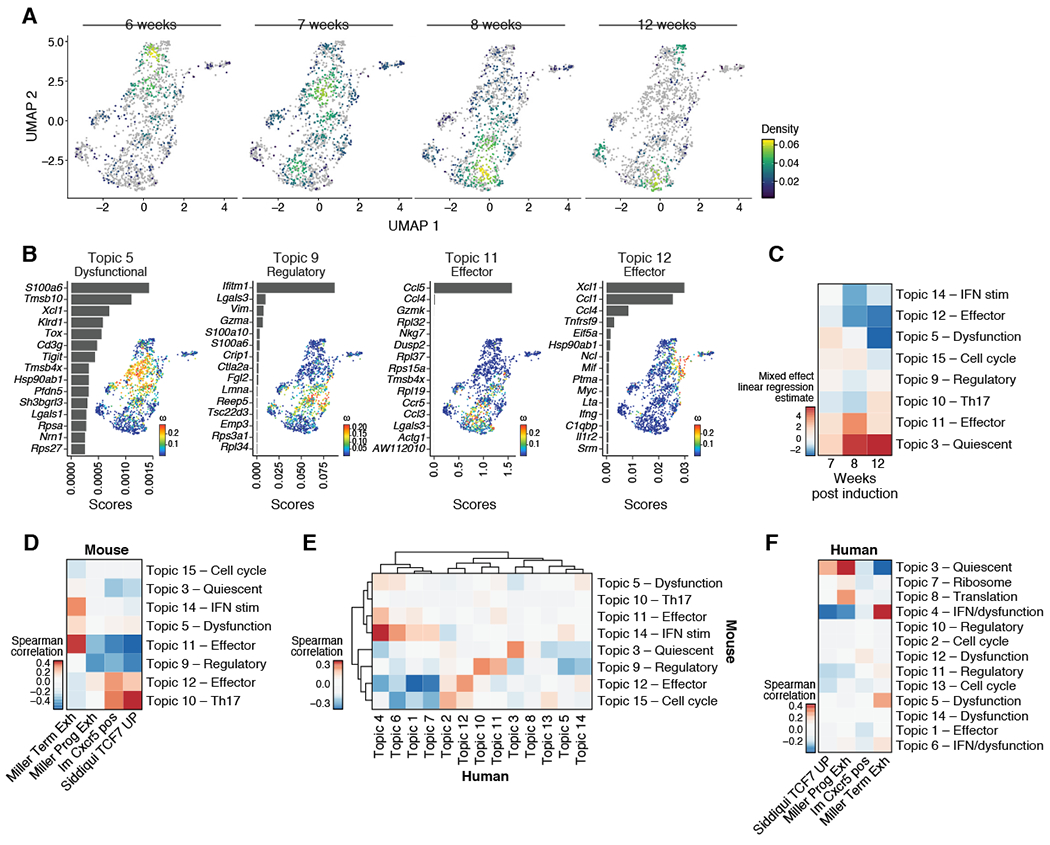
Figure 4. TCF-1+ tumor-specific CD8 T cells are transcriptionally diverse and shift over the course of tumor progression.

(A) UMAP embedding of all Tcf7+ tumor-specific CD8+ T cells (Bodhankar et al.) colored by cell density and faceted by time point. (B) Topic modeling of Tcf7+ tumor-specific CD8+ T cells. Shown is a bar plot of topic scores for top ranked genes (left), and UMAP of the cell profiles (as in A) colored by topic’s weight per cell (right). (C) Heatmap showing the estimates per time points (columns) relative to 6 weeks p.i. of a linear mixed effect model on the topic (rows) weights. (D) Only two topics of Tcf7+ tumor-specific CD8+ T cells correlated with reported signatures of precursor-exhausted Tcf7+ CD8+ T cells. Spearman correlation coefficient (color bar) between topic (rows) weights and signature (columns) z-score across cells for published signatures of Tcf7+ tumor-specific CD8+ T cells. (E-F) Data taken from Sade-Feldman et al., 2018. (E) Topics identified in Tcf7+ tumor-specific CD8+ T cells of this manuscript correlated with topics identified in human melanoma patients. Heatmap shows the spearman correlation coefficient (color bar) between human inferred topic (columns) weights and signature z-score when taking top 50 feature genes of mouse topics (rows) across TCF7+ CD8+ T cells of human melanoma patients. (F) Few topics of TCF7+ CD8+ T cells of human melanoma patients correlated with reported signatures of precursor-exhausted Tcf7+ CD8+ T cells in mice. Spearman correlation coefficient (color bar) between topic (rows) weights and signature (columns) z-scores across cells for published signatures for human Tcf7+ tumor specific CD8+ T cells. See also Supplemental Figure 4.
