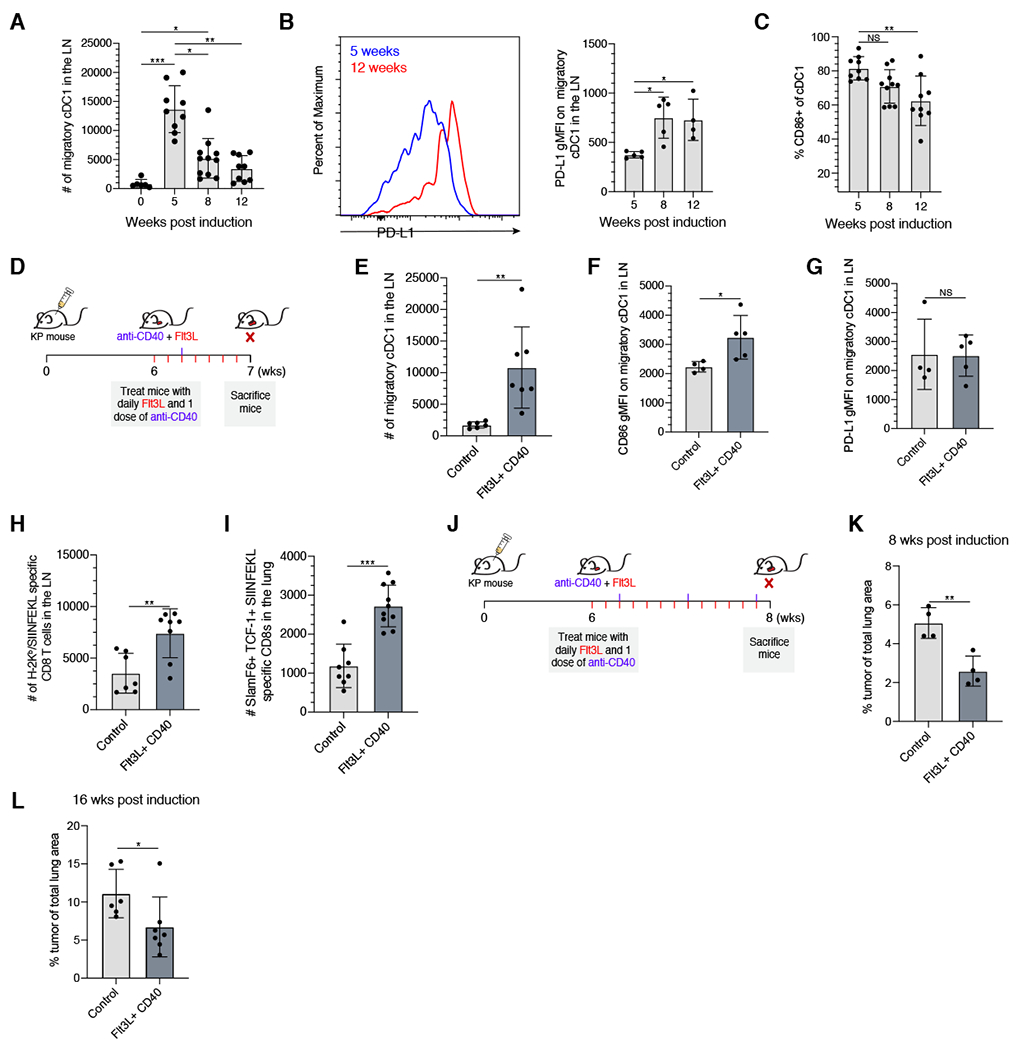
Figure 7. Migratory cDC1 quantity and quality in the dLN are important for maintaining the SlamF6+ TCF-1+ tumor-specific CD8+ T cell response.

(A) Number of migratory cDC1 isolated from the dLN at the designated timepoint post initiation. (B) Representative histogram showing PD-L1 expression on migratory cDC1 in the dLN node at 5 weeks (blue) and 12 weeks (red), and PD-L1 geometric MFI on migratory cDC1 in the dLN at the indicated timepoints. (C) Percent of cDC1 expressing CD86 by flow cytometry. (D) Boosting cDC1 numbers with Flt3L and agonistic anti-CD40; experimental schematic. (E) Number of migratory cDC1 in the dLN in control or Flt3L/agonistic CD40 treated animal after 1 week of treatment. (F & G) CD86 or PD-L1 geometric MFI on migratory cDC1 in the dLN in control or Flt3L/agonistic anti-CD40 treated KP mice after 1 week of treatment. (H) Total numbers of H-2Kb/SIINFEKL tetramer+ CD8+ T cells in dLN of control or Flt3L/agonistic anti-CD40 treated KP mice after 1 week of treatment. (I) Total numbers of SlamF6+ TCF-1+ H-2Kb/SIINFEKL tetramer+ CD8 T cells in tumor bearing lungs of control or Flt3L/agonistic anti-CD40 treated KP mice after 1 week of treatment. (J) Extended treatment with Flt3L and anti-CD40 antibody to assess tumor burden; experimental schematic. (K) Percent of total lung occupied by tumor at 8 weeks post induction in mice treated with Flt3L/anti-CD40 treated starting at 6 weeks post-induction or control mice. (L) Percent of total lung occupied by tumor at 16 weeks post induction in mice treated with Flt3L/anti-CD40 treated starting at 14 weeks post-induction or control mice. Tukey’s multiple comparisons test for A and B. Student t-test for D-H. Data from at least 2 experiments or 1 experiment representative of 2 experiments (geometric mean fluorescence intensity analysis) (dot: one mouse), Error bars: SD. *p<0.05, **p<0.001, ***p<0.001, NS: non-significant (p>0.05). See also Supplemental Figure 7.
