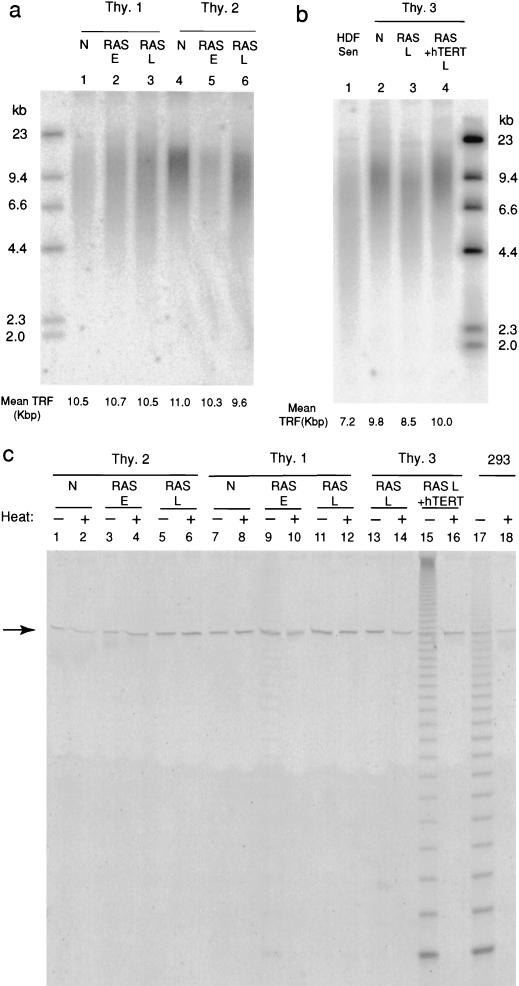
FIG. 3.
Analysis of telomere length and telomerase activity in thyroid cells expressing mutant RAS. (a) TRF analysis of HinfI/RsaI-digested genomic DNA from normal thyrocytes (N), and pools of early (proliferating) (RAS E) and late-stage (RAS L) RAS colonies derived from two separate human thyroid samples (Thy.1 and Thy.2). Mean TRF values were calculated from densitometry data as described in text. (b) TRF analysis of normal (N) and late-stage (RAS L) RAS colonies derived from a third thyroid sample (Thy.3), together with colonies expressing both mutant RAS and the catalytic subunit of human telomerase (RAS + hTERT). Senescent human fibroblasts (strain HCA2) are shown for comparison (HDF SEN). (c) Telomerase activity assessed by TRAP assay in normal cells (N), in pools of early colonies expressing mutant RAS (RAS E) and late-stage colonies expressing mutant RAS alone (RAS L) or with hTERT (RAS L + hTERT). Each sample is analyzed with (+) or without (−) prior heat treatment (85°C for 10 min). The immortal human epithelial cell line 293 is included as a positive control. The arrow indicates the position of the internal telomerase amplification standard as a control for nonspecific PCR inhibition.

