
FIGURE 3.
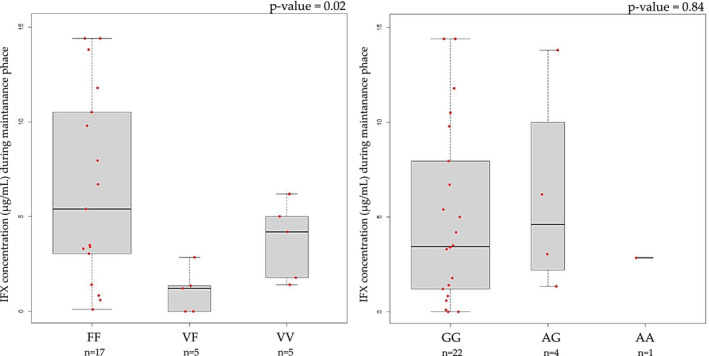
Boxplot comparing serum infliximab (IFX) concentration and candidate variants. The bold horizontal line represents the median value. Statistical significance was assessed by Kruskal Wallis test
Official websites use .gov
A
.gov website belongs to an official
government organization in the United States.
Secure .gov websites use HTTPS
A lock (
) or https:// means you've safely
connected to the .gov website. Share sensitive
information only on official, secure websites.
Boxplot comparing serum infliximab (IFX) concentration and candidate variants. The bold horizontal line represents the median value. Statistical significance was assessed by Kruskal Wallis test