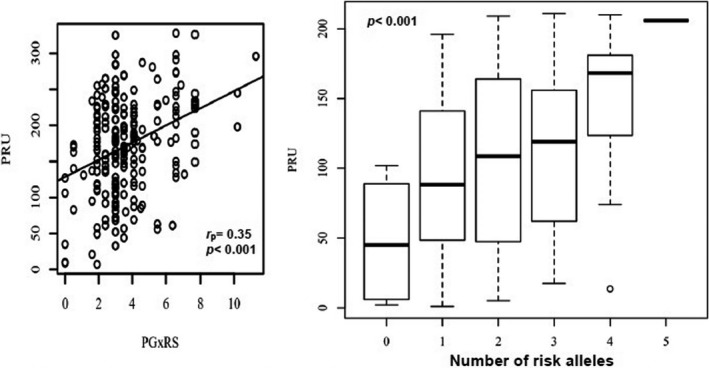
FIGURE 4.

Scatterplot between the weighted polygenic risk score (wPG × Rs) and P2Y12 reaction units (PRUs) with the regression line added for the Pearson’s correlation analysis (left panel) and PRU changes based on increasing number of risk alleles at genetic loci of predictive value for clopidogrel responsiveness in Caribbean Hispanics (right panel). Note: For each box plot, the horizontal line within each box indicates the median; the top and bottom borders of each box indicate the interquartile range. The whiskers extending from each box indicate the 95% confidence interval (CI) and the points beyond the whiskers indicate outliers beyond ±2.5% CI. PG × RS, weighted polygenic risk score
