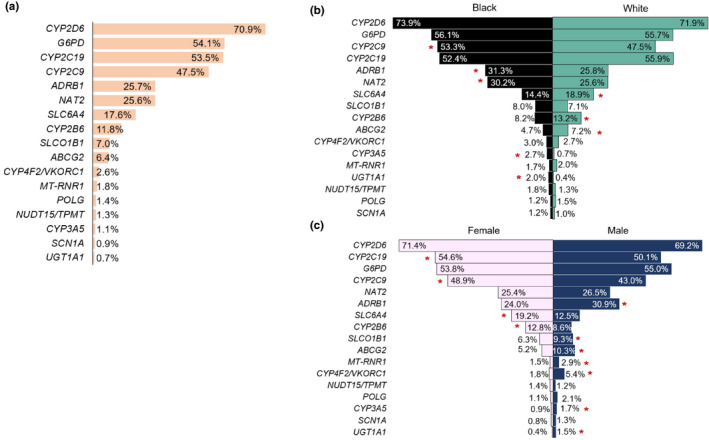
FIGURE 3.

Potential for pharmacogenomic actionability among Alabama Genomic Health Initiative participants assessed by medication prescribing (a) overall, (b) by race, and (c) by gender. Red asterisks indicate a significant difference in prescribing frequency and the group with higher exposure. Genes with less than 1% exposure in all groups and not included: DPYD (fluoropyrimidines) and IFNL3/IFNL4 (peginterferon alfa 2a/2b)
