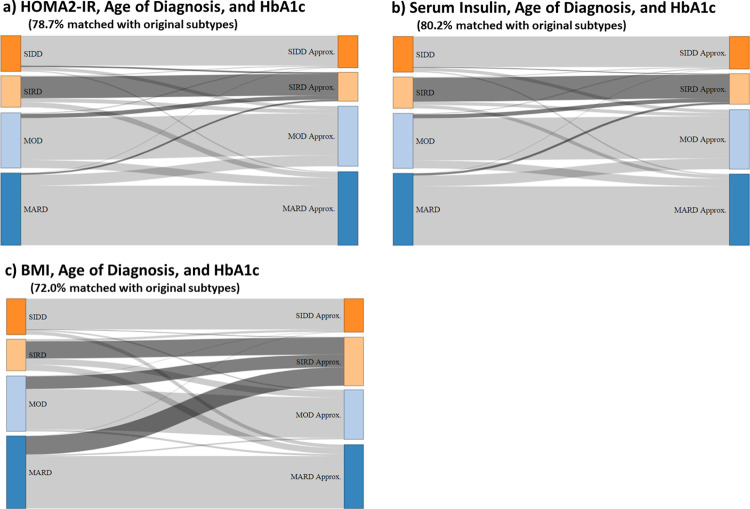
Fig 4. Sankey flow diagram showing the change in distribution comparing when the patients are subtyped according to Ahlqvist et al.’s original methodology (k-means clustering with HbA1c, HOMA2 IR, HOMA2 B, BMI, and age of diagnosis, shown to the left) with the distribution when the patients are subtyped by k-means clustering with reduced number of patient characteristics (shown to the right).
HOMA2 IR = homoeostatic model assessment 2 estimates of insulin resistance, SIDD = severe insulin-deficient diabetes, SIRD = severe insulin-resistant diabetes, MOD = mild obesity-related diabetes, MARD = mild age-related diabetes. Approx. indicates the approximation of the original clustering-based diabetes subtypes using reduced number of patient characteristics.

