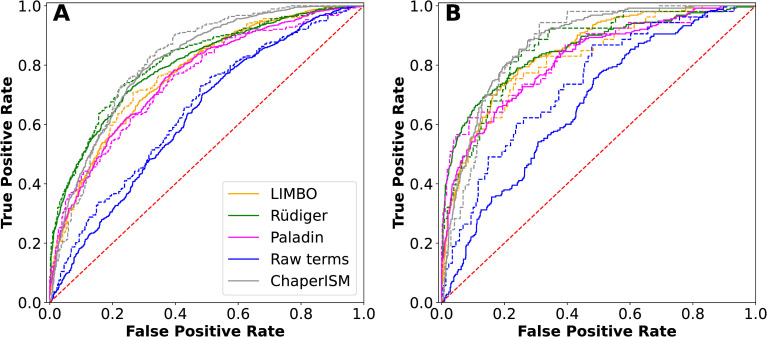
Fig 5. Receiver operating characteristic curves of various predictors.
The raw score was calculated using the energy terms with uniform weights. (A) Discrimination of both strong binders and binders from nonbinders, and (B) Discrimination of strong binders from nonbinders. All solid lines were derived from the training set and dotted lines from the validation set. The red dashed diagonal line represents a random prediction.

