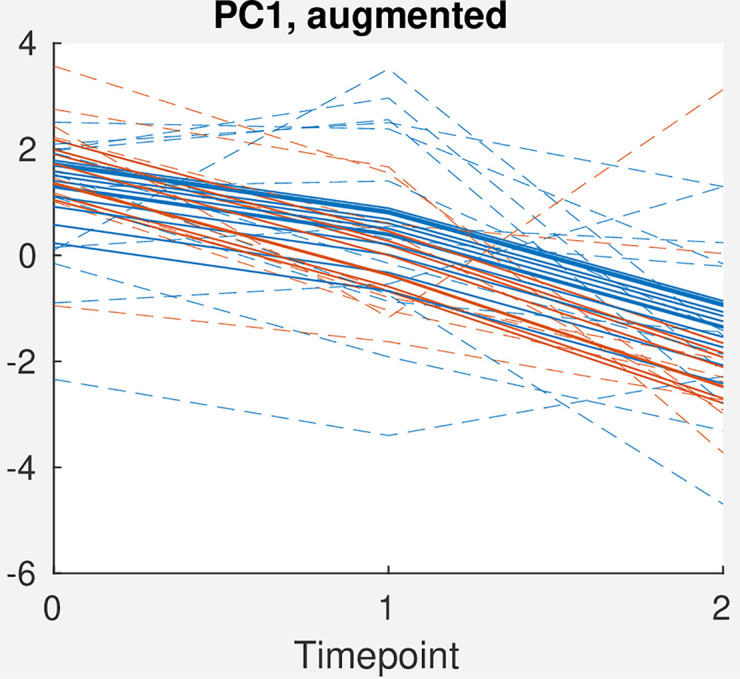
Fig 2.

Score plot for PC1 for the effect matrix for time + time*treatment, augmented with random effects (continuous lines) and both random effects and residuals (dashed lines). Only a random subset of patients with complete data are included in the plot. Orange: Chemotherapy + Bevacizumab. Blue: Chemotherapy only.
