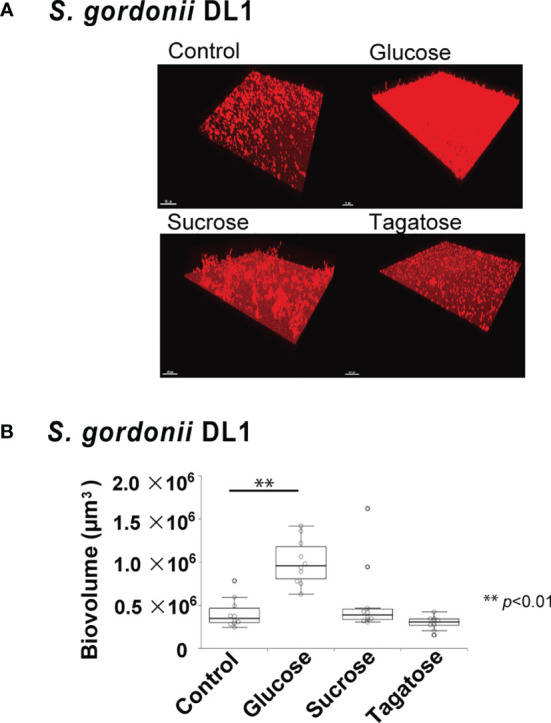
Figure 8.

Effects of D-Tagatose on S. gordonii biofilm formation. (A) Representative CLSM images showing typical architecture of biofilms following reconstruction with Imaris software. S. gordonii cells were stained with hexidium iodide (red), and incubated with saccharides or nothing was added. (B) Biovolume analysis of S. gordonii. Ten fields per sample were randomly recorded with CLSM and S. gordonii biovolume was quantified using IMARIS software. Control, containing no sugar. **P < 0.01.
