
Figure 6.
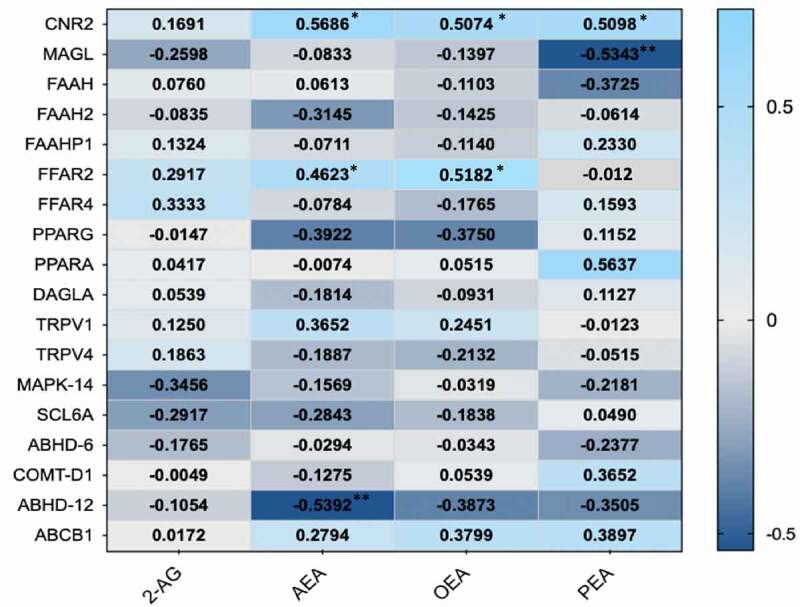
Heat map indication positive (light blue) and negative (dark blue) associations of ECs with gene expression levels of specific EC and SCFA receptor proteins. (*p < .05)
Official websites use .gov
A
.gov website belongs to an official
government organization in the United States.
Secure .gov websites use HTTPS
A lock (
) or https:// means you've safely
connected to the .gov website. Share sensitive
information only on official, secure websites.
Heat map indication positive (light blue) and negative (dark blue) associations of ECs with gene expression levels of specific EC and SCFA receptor proteins. (*p < .05)