Figure 5.

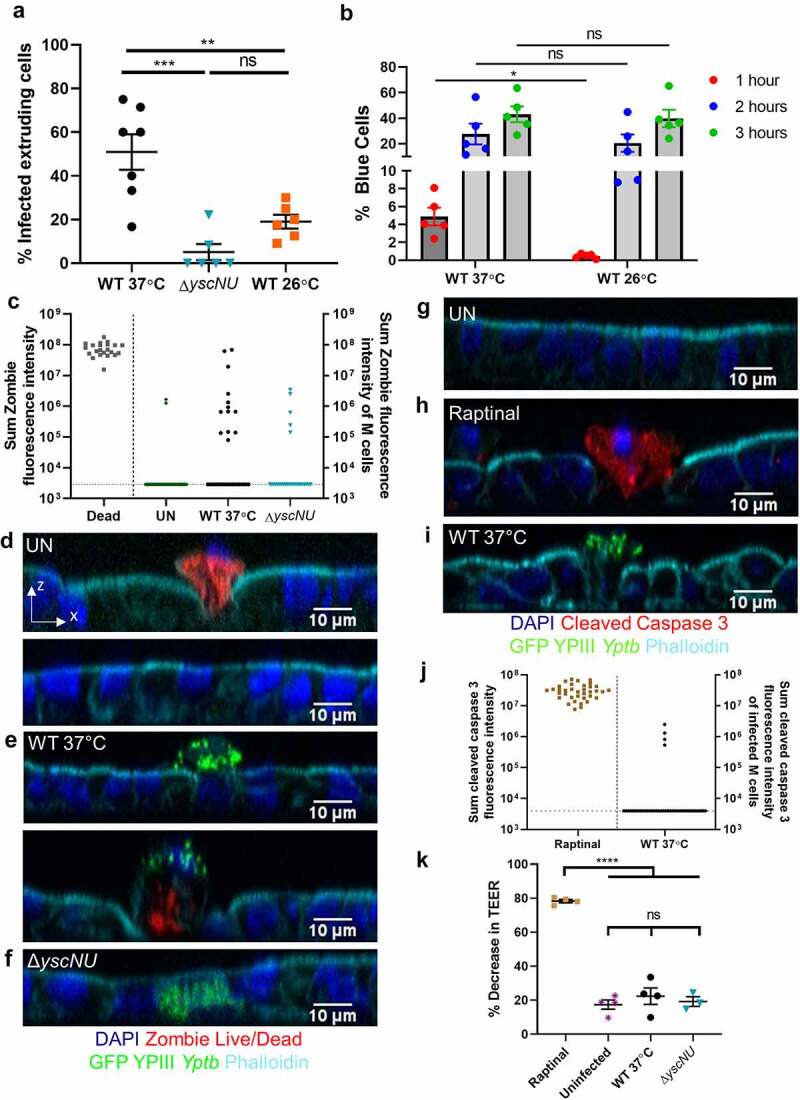
Yptb T3SS causes M cell extrusion independent of cell death. (a) Differentiated HIE25 RT+ ileal monolayers were infected for 5 hours with 5 × 10⁶ CFU of WT 37°C, ΔyscNU, or WT 26°C YPIII Yptb expressing GFP. The percentage of extruding infected M cells per field was plotted. Each point represents one Transwell. Bars indicate mean and SEM. Data were pooled from 3+ independent experiments with 2–4 fields analyzed per Transwell and averaged. Statistics were performed with a one-way ANOVA and Tukey’s post hoc multiple comparison tests. (b) HEp-2 cells were infected for 1 h, 2 h, or 3 h with WT YPIII Yptb expressing YopETEM grown at 37°C or 26°C and were analyzed for % blue cells (TEM-positive). Each point represents an independent experiment. Statistics were performed with a two-way ANOVA on paired data and Sidak’s post hoc multiple comparison tests. (c-f) Differentiated HIE25 RT+ ileal monolayers were (d) uninfected or infected for 5 hours with 5 × 10⁶ CFU (e) WT 37°C, or (f) ΔyscNU YPIII Yptb expressing GFP (green) and stained with Zombie Live/Dead stain (red), DAPI (nuclei-blue), and phalloidin (F-actin-cyan). Orthogonal XZ planes are shown. (c) Sum fluorescence intensity of Zombie. Each point represents a dead extruding cell or an M cell that was uninfected (GP2+) or infected with WT 37°C or ΔyscNU YPIII Yptb expressing GFP. 37 uninfected, 32 WT 37°C-infected, and 27 ΔyscNU-infected M cells were analyzed. Horizontal line indicates limit of detection. Data were pooled from 3 independent experiments. (g-i) Differentiated HIE25 RT+ ileal monolayers were (g) uninfected, (h) treated with 13 µM raptinal, or (i) infected for 5 hours with 5 × 10⁶ CFU WT 37°C YPIII Yptb expressing GFP (green) and stained for cleaved caspase 3 (red), DAPI (nuclei-blue), and phalloidin (F-actin-cyan). (j) Sum fluorescence intensity of cleaved caspase 3. Each point represents either a raptinal-induced apoptotic epithelial cell or a WT 37°C-infected M cell. 40 WT 37°C-infected M cells were analyzed. Horizontal line indicates limit of detection. (k) TEER was measured before and after infection and plotted as % decrease. Statistics were performed with a one-way ANOVA and Tukey’s post hoc multiple comparison tests. (j-k) Data were pooled from 3–4 independent experiments
