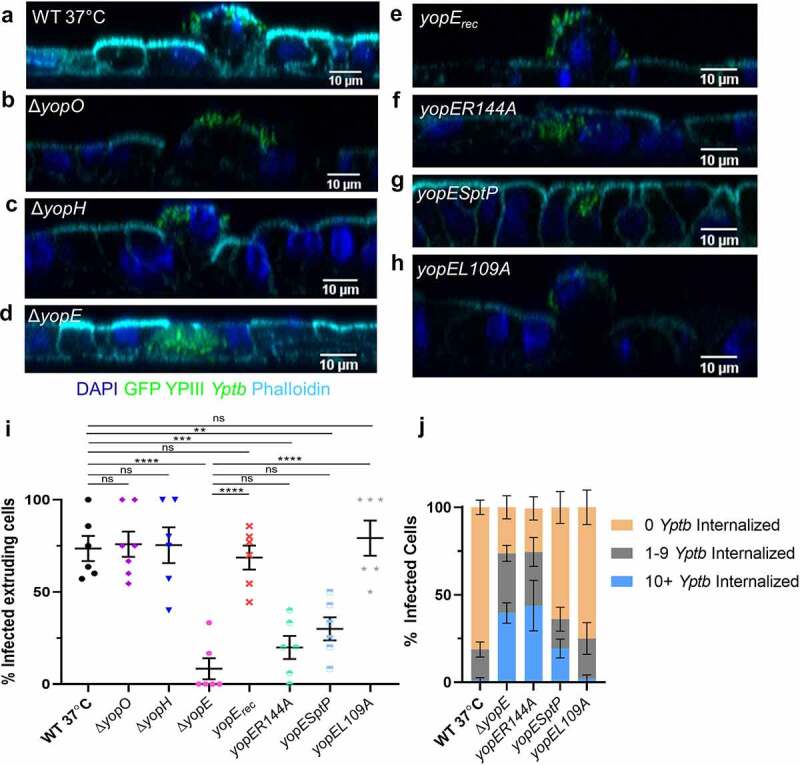
Figure 6.

YopE causes M cell extrusion. (a-h) Differentiated HIE25 RT+ ileal monolayers were infected for 5 hours with 5 × 10⁶ CFU of (a) WT 37°C, (b) ΔyopO, (c) ΔyopH, (d) ΔyopE, (e) ΔyopE+yopErec, (f) ΔyopE+yopER144A, (g) ΔyopE+YopE1-100SptP166-293 or (h) ΔyopE+yopEL109A YPIII Yptb expressing GFP (green). Monolayers were stained with DAPI (nuclei-blue) and phalloidin (F-actin-cyan). Orthogonal XZ planes were analyzed for M cell extrusion. (i) The percentage of extruding infected M cells per field was plotted. Each point represents one Transwell. Bars indicate mean and SEM. Statistics were performed with a one-way ANOVA and Tukey’s post hoc multiple comparison tests. (j) The number of Yptb internalized in each M cell was determined and the percentage of cells with specified number of internalized Yptb per field was plotted. Error bars indicate SEM. The data for WT 37°C and ΔyopE are the same as in Figure 4 k. Statistics were performed using a two-way ANOVA and Tukey’s post hoc multiple comparison tests and are shown in Table S4. (i-j) Data were pooled from 3+ independent experiments with 2–4 fields analyzed per Transwell and averaged
