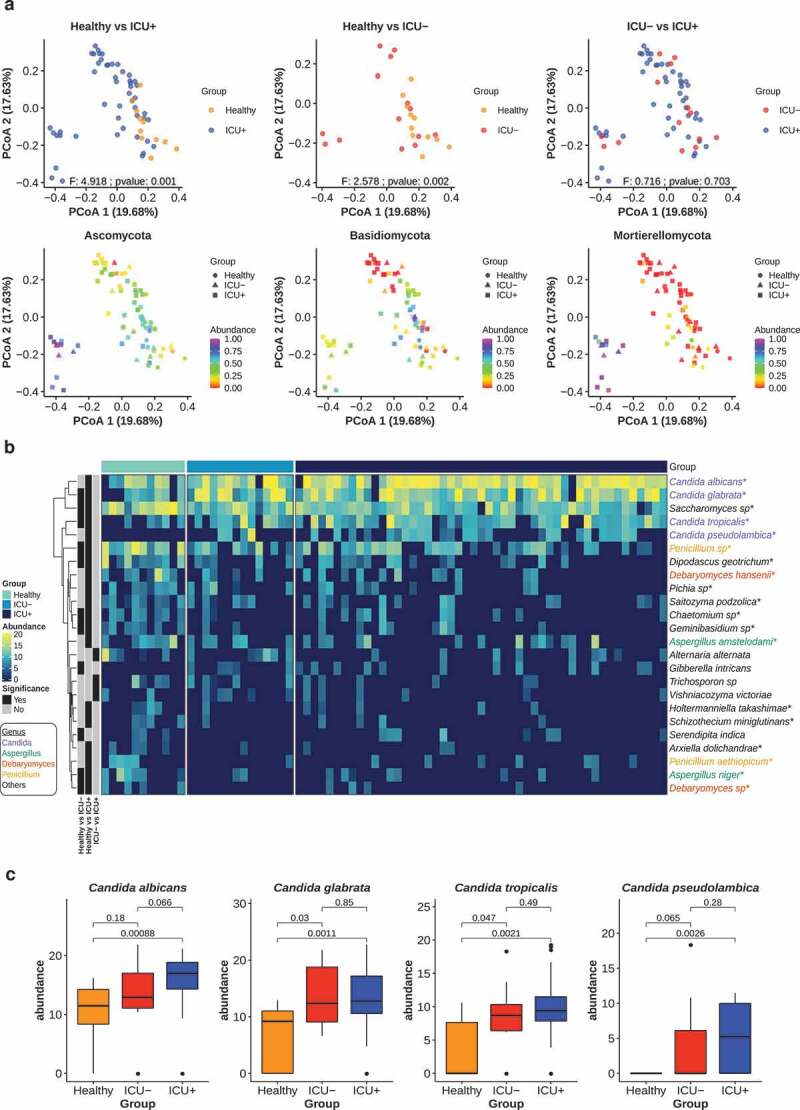
Figure 6.

ICU patients have distinct mycobiome profiles
(a) Upper – PCoA plots of the gut mycobiome based on species-level Bray-Curtis distances. Color indicates the groups. Significant differences were determined using PERMANOVA (P < .05). Lower – the same PCoA plots as upper panel highlighting the top 3 most abundant fungal phyla (Ascomycota, Basidiomycota and Mortierellomycotina). Color scale indicates the relative abundance of each phylum. Groups are defined by shapes.(b) Heatmap showing the normalized abundances of significantly differentially abundant species in Healthy vs ICU+, Healthy vs ICU–, ICU+ vs ICU– comparisons (P < .05, Wilcoxon rank-sum test). Cumulative Sum Scaling (CSS) was used for species abundances normalization. The annotation bars on the left indicate the comparisons in which the species was found to be significant. The names of species are colored according to their affiliated genera. Differentially abundant species in ICU+ vs Healthy comparison after FDR correction (FDR<0.25) are marked with *.(c) Boxplots comparing the normalized abundances of specific Candida species (Wilcoxon rank-sum test).
