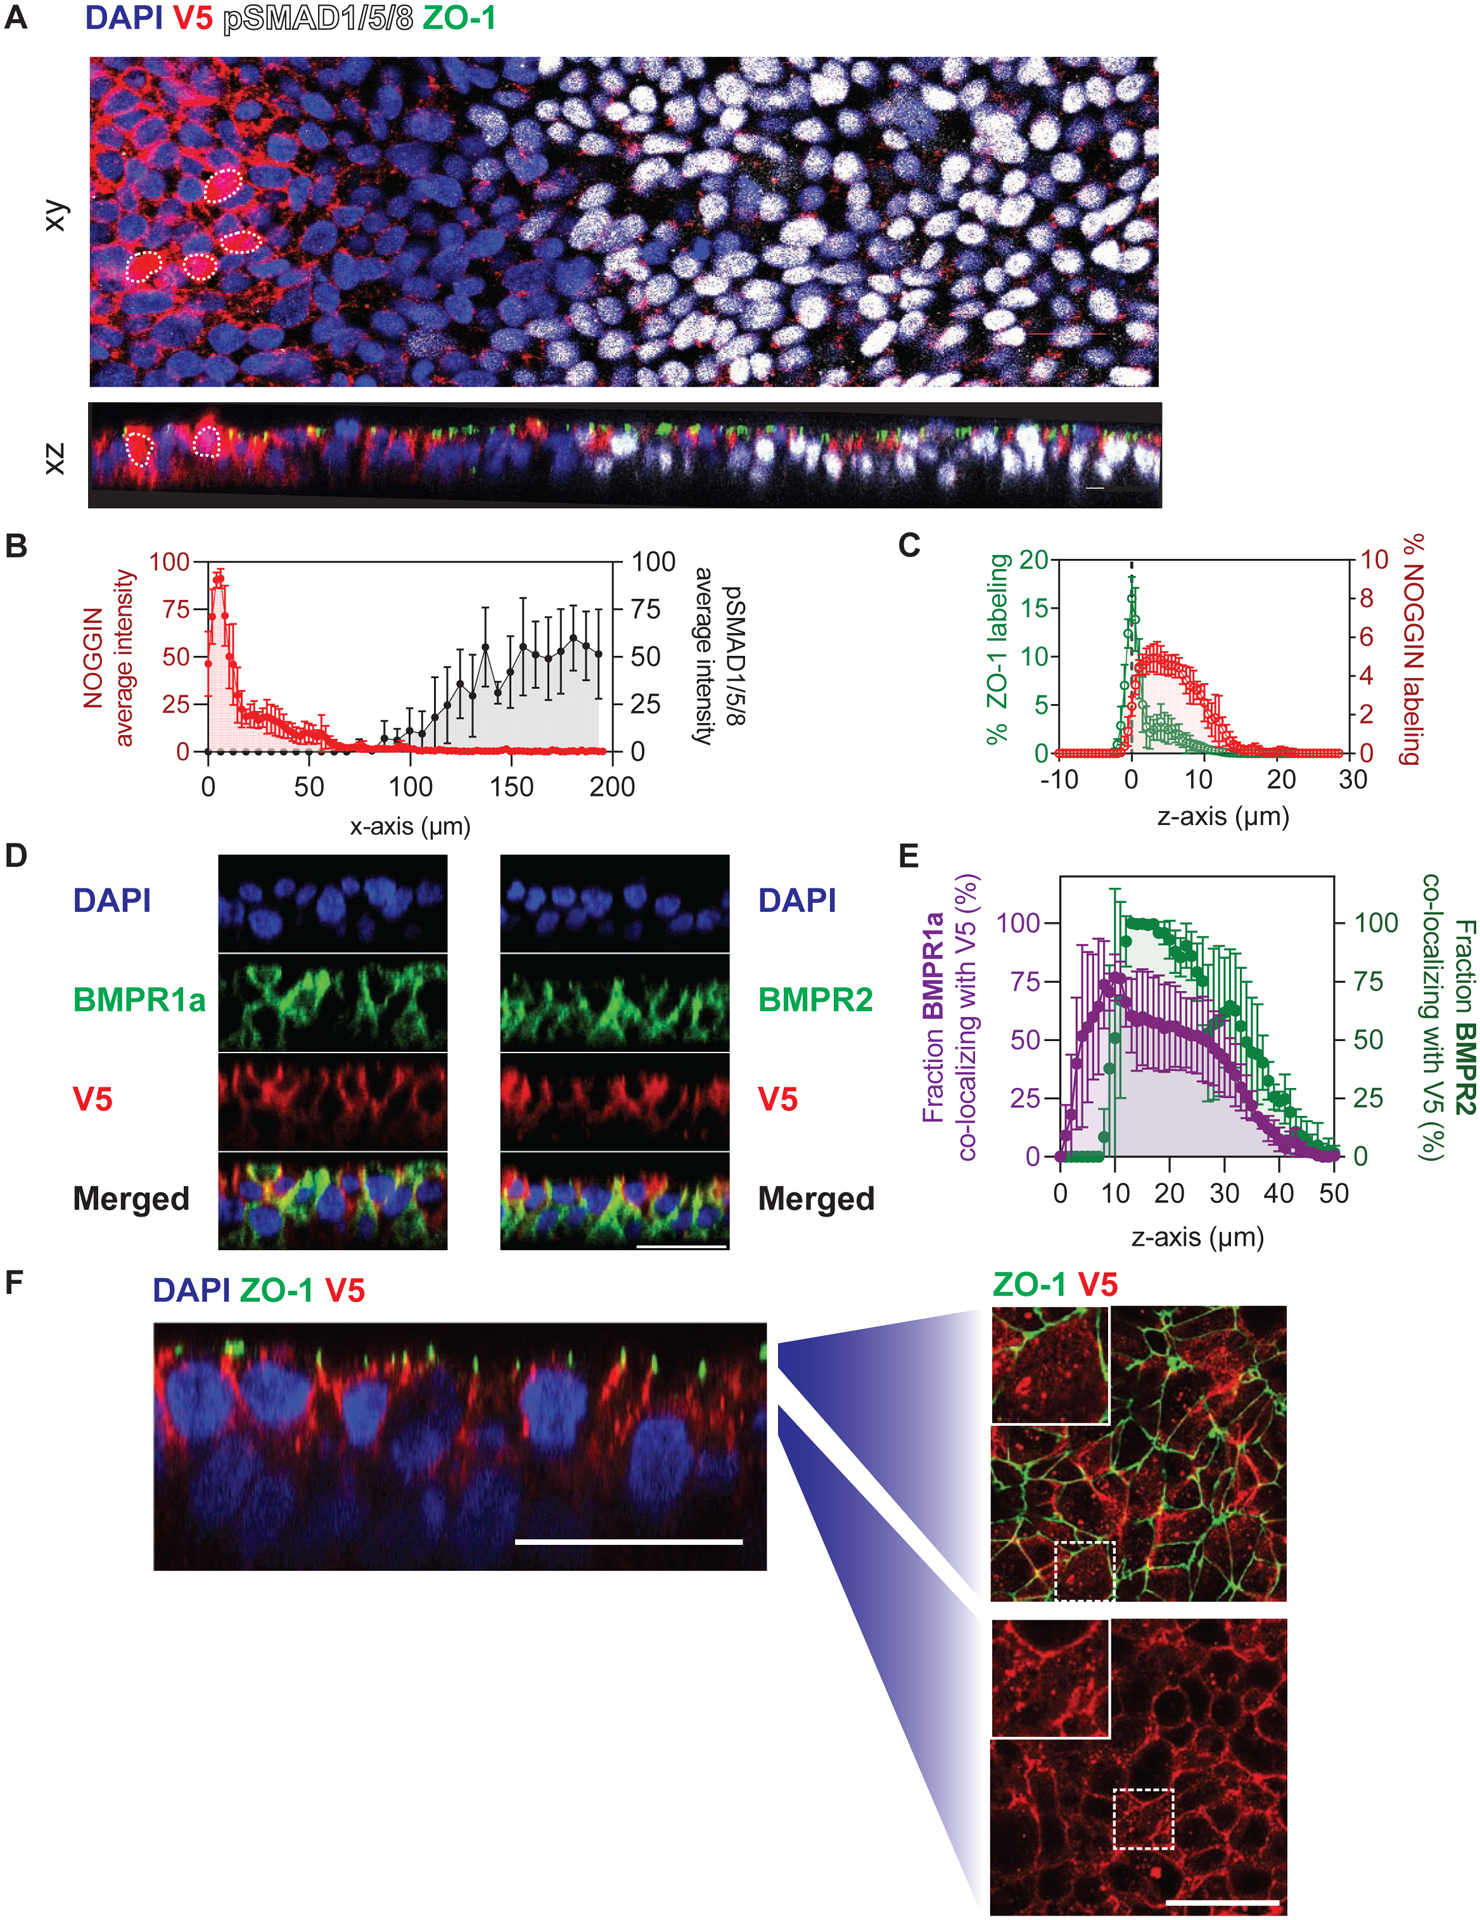
Figure 5: NOGGIN was detected laterally beneath tight junctions and as puncta in receiving cells.

(A) NOGGIN spread to neighboring cells away from secreting cells. A small number of TRE::V5-NOGGIN cells were co-cultured with WT hESCs on filter. Cells were induced to produce NOGGIN for 8 hrs before BMP4 (10 ng ml−1) was applied basally for 1 hr. NOGGIN immunolabeling was done with α-V5 antibodies. White dashed outlines indicate NOGGIN-secreting cells. Top (xy): confocal image of the epithelium through a single z-plane. Bottom (xz): sagittal (z-plane) view of the same epithelium. Scale bars = 25 μm. (B) Quantification of NOGGIN and pSMAD1/5/8 average pixel intensity profiles relative to each other along the x-axis. (The peak of NOGGIN intensity correlates with the location of a NOGGIN-secreting cell.) As NOGGIN intensity dropped off, pSMAD1/5/8 intensity increased. Error bars = SD. (C) Quantification of NOGGIN distribution along the z-axis with respect to ZO-1. NOGGIN localized at and below the level of tight junctions. Error bars = SD. (D) Sagittal (z-plane) view showing NOGGIN co-localizing with BMPR1a and BMPR2. TRE::V5-NOGGIN cells were co-cultured with TRE::BMPR1A-Myc or TRE::BMPR2-HA hESCs on filter (ratio 1:100). Cells were induced to express NOGGIN and BMPR1A/BMPR2 for 24 hrs. BMPR1A and BMPR2 labeling was detected by α-Myc antibodies and α-HA antibodies, respectively. Subsequently, NOGGIN-BMPR co-localization was analyzed in cells at least 5-cell-diameter away from NOGGIN-producing cells. (E) Quantification of the overlap of BMPR1a (left axis, purple) and BMPR2 (right axis, green) with NOGGIN. NOGGIN expression profile was used as a reference to determine the relative z-position. Error bars = SD. (F) Sagittal (z-plane) view showing NOGGIN localization in the epithelium. TRE::V5-NOGGIN cells were co-cultured with WT hESCs (ratio 1:200). Cells were induced to express NOGGIN for 24 hrs. Subsequently, NOGGIN localization was analyzed in cells 5-cell-distance away from NOGGIN-producing cells. Zoom-out panels show transverse views at the corresponding z-position. NOGGIN appeared as puncta (white arrows) at and below tight junction levels. Scale bars = 25 μm.
