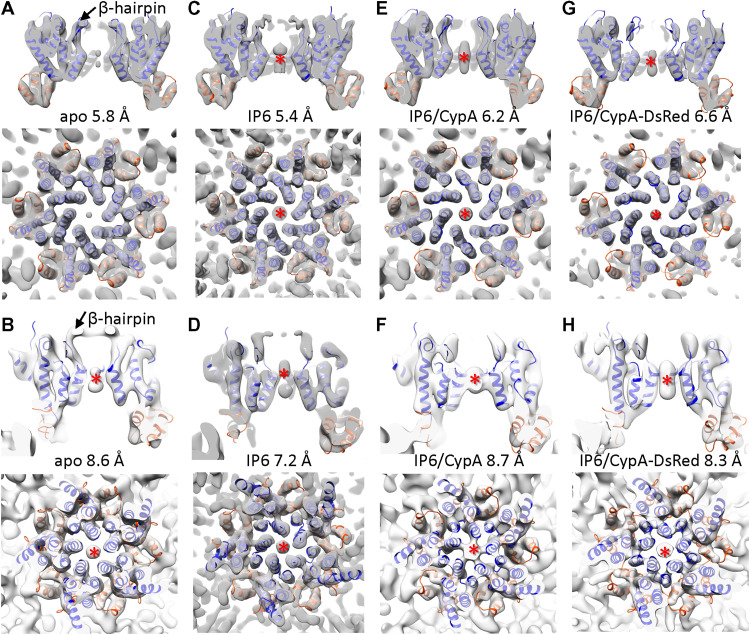
Fig. 3. Structures CA hexamers and pentamers from native cores.
(A and B) Subtomogram averages of CA hexamer (A) and pentamer (B) from native PFO-treated HIV-1 VLPs (apo state). (C and D) Subtomogram averages of CA hexamer (C) and pentamer (D) from PFO-treated VLPs in the presence of IP6. (E and F) Subtomogram averages of CA hexamer (E) and pentamer (F) from PFO-treated VLPs in the presence of IP6 and CypA. (G and H) Subtomogram averages of CA hexamer (G) and pentamer (H) from PFO-treated VLPs in the presence of IP6 and CypA-DsRed. Density maps are shown in sectional views from side and top, superimposed with the CA atomic model (PDB 4XFX), with CANTD and CACTD fitted separately, colored in blue and orange, respectively. The resolution of each map is indicated. Red asterisks indicate the IP6 density in CA hexamers and pentamers.

