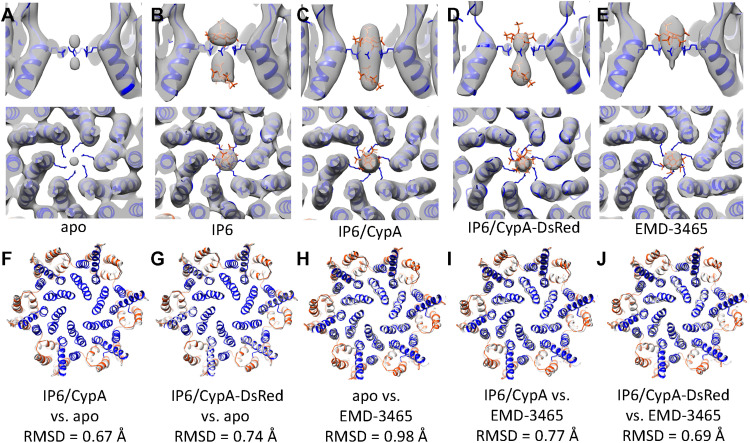
Fig. 4. Comparison of CA hexamer structures with/without IP6.
(A to E) Comparison of IP6 density in apo (A), IP6 complex (B), IP6/CypA complex (C), IP6/CypA-DsRed complex (D), and EMD-3465 (E). R18 side chain is shown in blue. Two IP6 molecules (red) were modeled in by aligning the CA hexamer to the cross-linked CA hexamer in IP6 cocrystals (PDB 6BHT). (F and G) Comparison of CA hexamer backbone between apo (colored gray) and IP6/CypA complex (F) and IP6/CypA-DsRed complex (G). (H to J) Comparison of CA hexamer backbone between EMD3465 (colored gray) and apo (H), IP6/CypA complex (I), and IP6/CypA-DsRed complex (J).

