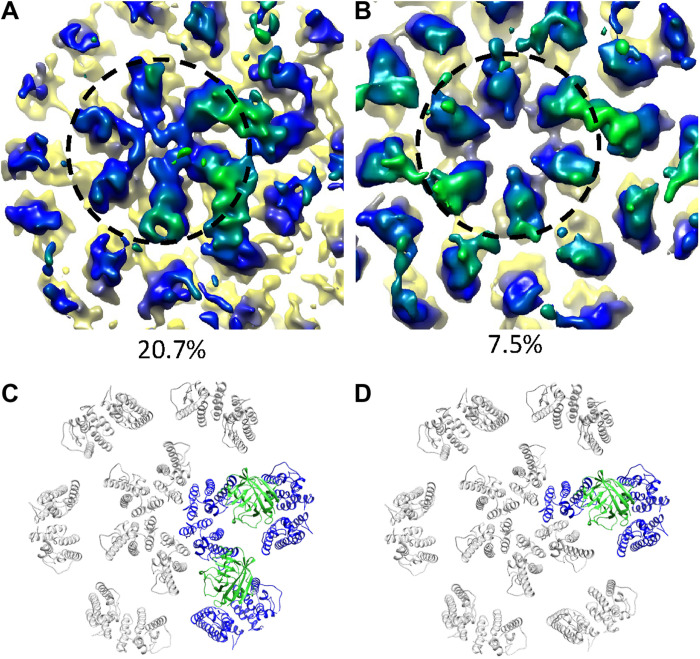
Fig. 6. Subtomogram classification and averaging of CypA-DsRed tetramer binding to the native capsid.
(A and B) Density maps of two classes from principal components analysis PCA–based localized classification of capsid/CypA-DsRed complex, with two CypA densities (A) and one CypA density (B). Dashed circle encloses a CA hexamer. (C and D) Molecular models of the above binding modes, respectively, by rigid-body fitting. CypA is represented by green ribbons, and CypA-interacting CA molecules are represented by blue ribbons.

