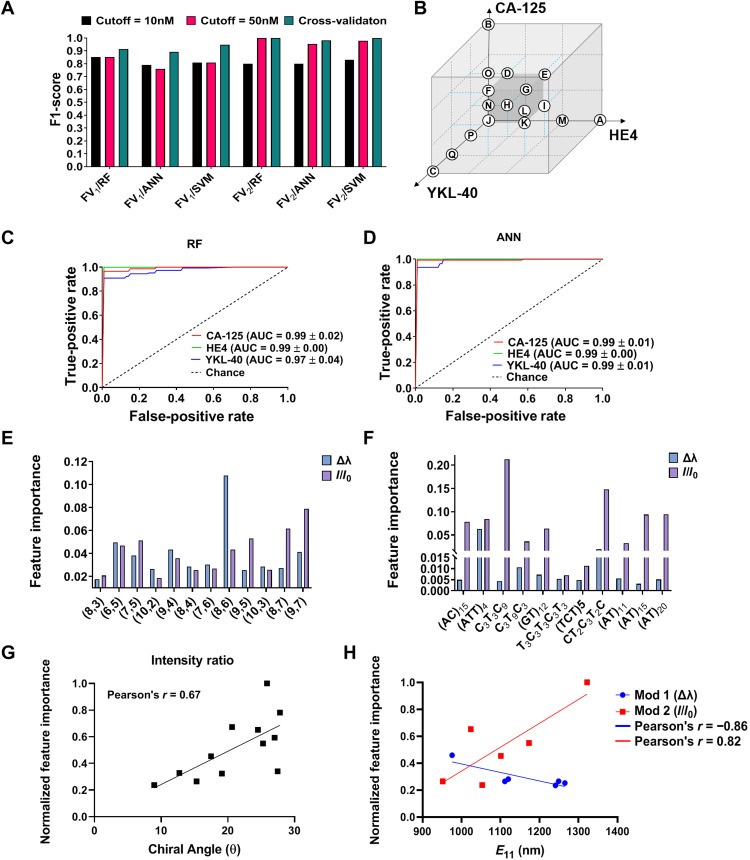
Fig. 4. ML results and analysis.
(A) F1-scores of three algorithms for each FV corresponding to different thresholds. (B) Schematic of training/testing method for different concentrations of biomarker combinations. (C) Receiver operating characteristic (ROC) of each biomarker via RF model. Area under the curve (AUC) values for each biomarker. (D) ROC of each biomarker via ANN model. AUC values for each biomarker. (E) Feature importance of SWCNT chiralities generated by FV1. (F) Feature importance of DNA sequences generated by FV2. (G) Intensity change feature importance versus SWCNT chiral angle. (H) Normalized feature importance values of wavelength shift (Δλ) and intensity change versus SWCNT emission wavelength.

