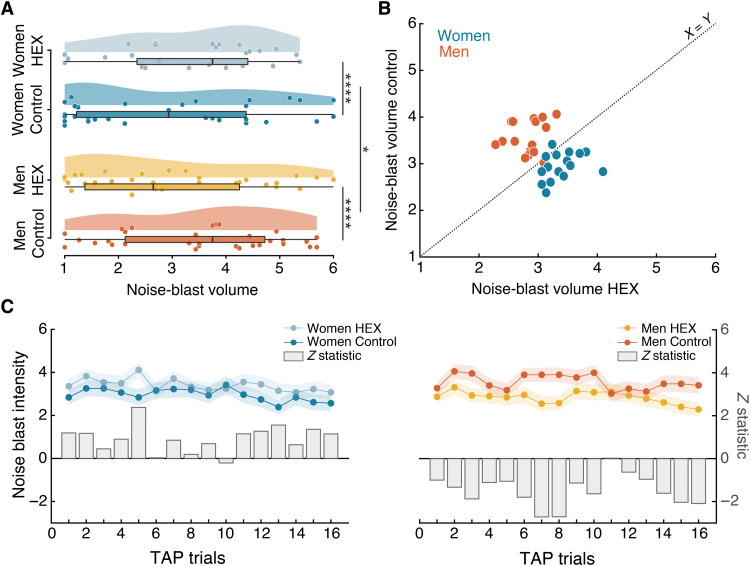
Fig. 3. Exposure to HEX modulated aggressive behavior in a sex-dependent manner across participants.
(A) Group-mean noise-blast volume. Men: n = 67 (34 Control). Women: n = 60 (31 Control). Each dot is the mean of a participant, the thick vertical line is the median, the rectangle reflects the IQR (25th to the 75th percentiles), and the whiskers are no more than 1.5 * IQR of the upper and lower hinges. (B) Trial-wise mean noise-blast volume. Each dot is the mean of a trial (1 to 16) of all men (orange) or women (blue) participants. The y axis reflects the trial mean during Control, and the x axis reflects the trial mean during HEX. The dotted line is the unit slope line (X = Y) such that data under the line reflect increased aggression in HEX and data above the line reflect decreased aggression in HEX. (C) Trial-by-trial depiction across participants. The dots reflect mean ratings, the shaded area reflects the SE, and the gray bars reflect a trial-by-trial Z statistic; both plots share the y axis. All tests were two-tailed, and all error bars represent SEM. *P < 0.05, ****P < 0.0005.

