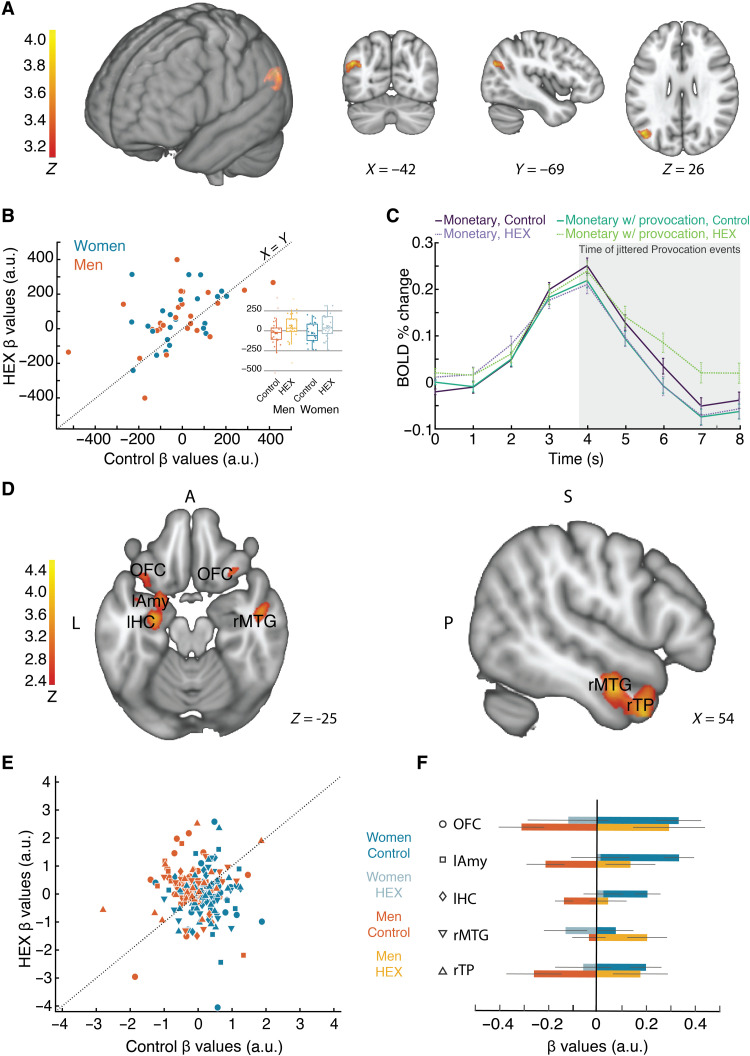
Fig. 7. HEX drives sex-specific functional connectivity in the brain substrates of aggression.
(A) Contrast ANOVA statistical parametric map depicting activity greater during provocation versus baseline in HEX versus Control (P < 0.001, corrected). (B) β values extracted from the left AG. Each dot is a woman (blue) or man (orange) participant. The y axis reflects participant’s mean β during HEX, and the x axis reflects participant’s mean β during Control (all during a Provocation). The dotted line is the unit slope line (x = y) such that data under the line reflect increased activation in Control and data above the line reflect increased activation in HEX. (C) Percent signal change in blood oxygen level–dependent (BOLD) activity in the left AG ROI, depicted by condition. (D) Contrast statistical parametric map depicting functional connectivity with the left AG greater during provocation versus baseline in HEX versus Control in Men > Women (P < 0.01, corrected). OFC, orbitofrontal cortex; lAmy, left amygdala; lHC, left hippocampus; rMTG, right medial temporal gyrus; rTP, right temporal pole. (E) β values for functional connectivity with the angular gyrus. Each dot is a woman (blue) or man (orange) participant; shape of dot is as depicted in (F). (F) Bar graph of the β values of functional connectivity of Provocation > Baseline, HEX > Control, and Women > Men for whole-brain connectivity analysis with the AG as a seed region.

