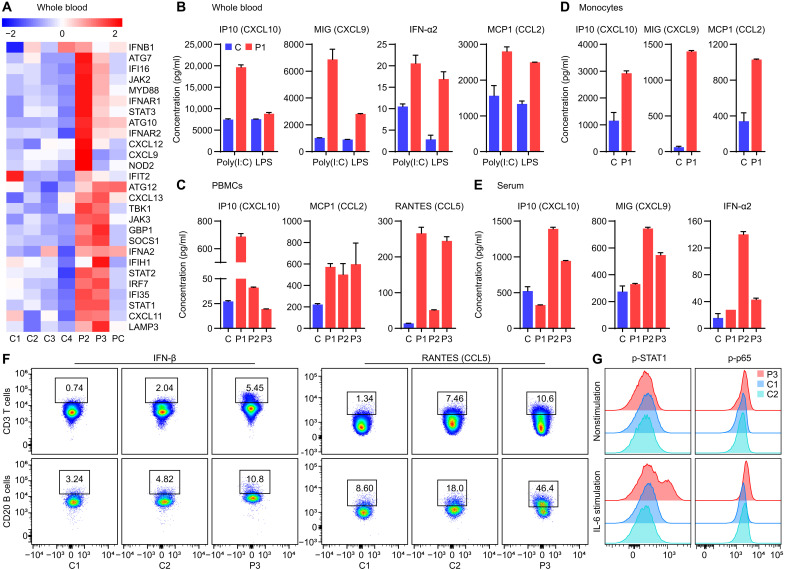
Fig. 1. Patients with otulipenia display overactivation of IFN-I signaling.
(A) NanoString analysis of IFN-I signaling in whole blood samples from two patients, four healthy controls, and a type I interferonopathy patient control (PC) with deoxyribonuclease 2 deficiency. (B) Cytokine levels in whole blood samples. The whole blood samples from P1 and his unaffected sibling were stimulated with poly(I:C) (20 μg/ml) or LPS (1 μg/ml) for 22 hours. (C) Cytokine levels in the supernatant of cultured PBMCs from three patients and one healthy control. (D) Cytokine levels in the supernatant of purified monocytes from P1 and three healthy controls. Cells used to detect IP10 and monokine induced by IFN-γ (MIG) were at basal level. Cells used to detect monocyte chemoattractant protein 1 (MCP1) were stimulated with LPS (1 μg/ml) for 48 hours. P1 was sampled twice. (E) Serum cytokine levels from three patients and seven healthy controls. (F) Intracellular cytokine staining of IFN-β and RANTES (CCL5) in T cells and B cells of P3 and two healthy controls. (G) Phosphorylation of STAT1 and p65 of patient P3 T cells compared to two healthy controls at basal level and after IL-6 (100 ng/ml) stimulation for 6 hours as determined by flow cytometry analysis. The patients carry homozygous disease-associated variants in OTULIN: P1 (Leu272Pro), P2 (Tyr244Cys), and P3 (Gly174Aspfs*2).

