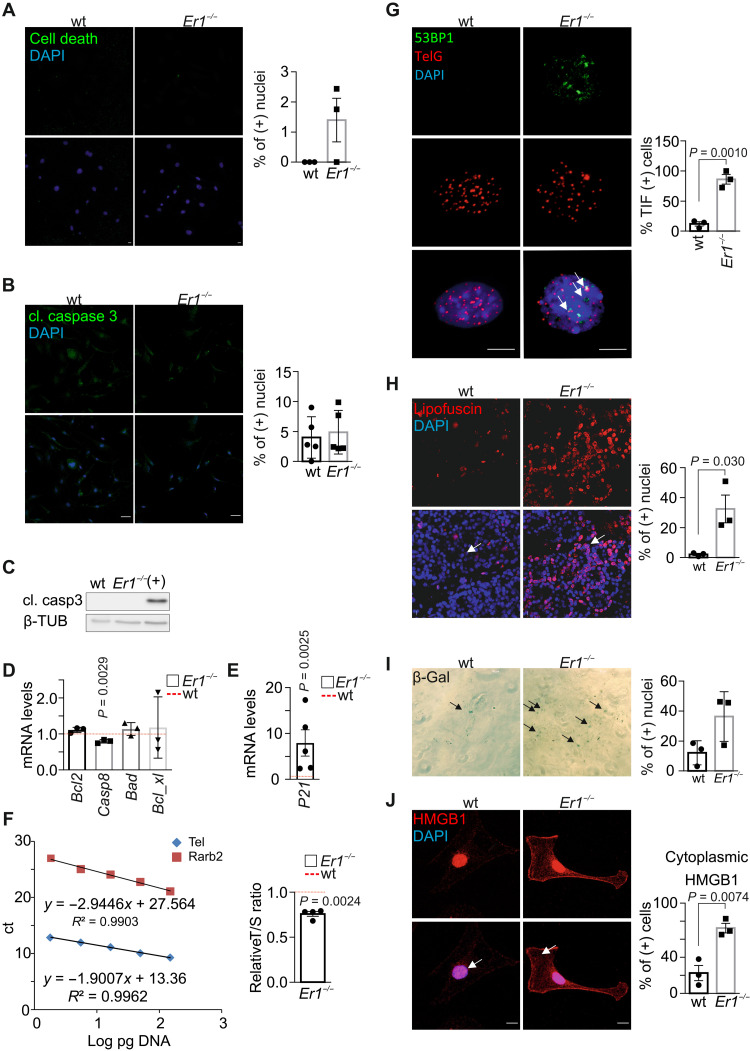
Fig. 2. Er1−/− pancreatic cells present senescent, but not apoptotic, characteristics.
(A) TUNEL in wt and Ercc1−/− (Er1−/−) PPCs (n = 3). (B) Immunostaining of cleaved (cl.) caspase 3 in wt and Er1−/− PPCs (n = 5). (C) Cleaved caspase 3 (casp3) in wt and Er1−/− pancreas whole-cell extracts. UV-irradiated (20 J/m2) wt BMDM protein extracts were used as positive control (+) (n = 3). (D) Bcl2, Casp8, Bad, and Bcl_xl mRNA levels in Er1−/− compared to wt pancreata (n = 3). (E) P21 mRNA levels in Er1−/− compared to wt pancreata (n = 5). (F) Telomere length in wt and Er1−/− pancreata compared to a single-copy gene (Rarb2). The graphs depict the standard curves for telomere (Tel) and Rarb (left) and the relative telomere to Rarb [telomere/single copy gene (T/S)] ratio in wt and Er1−/− pancreata (right, n = 4). ct, cycle threshold. (G) Immunofluorescence in situ hybridization of 53BP1 with telomeric DNA (TelG) in wt and Er1−/− PPCs. Arrows denote TIFs on telomeres. The graph depicts the mean percentage of cells containing ≥2 TIFs ± SD, n = 3. (H) Lipofuscin staining, as depicted by GL13 binding (SenTraGor), in wt and Er1−/− pancreata (n = 3). (I) SA-β-gal assay in wt and Er1−/− PPCs (n = 3 technical replicates). (J) Immunostaining of cytoplasmic HMGB1 in wt and Er1−/− PPCs (white arrows; n = 3). In (D) and (E), the red dashed lines represent the wt levels. The graphs in (H) and (I) depict the percentage of positive-stained cells and, in (J), cytoplasm-positive–stained cells. Tissues and cells are derived from P15 mice. Scale bars, 5 μm. Error bars indicate SEM among n ≥ 3 replicates.

