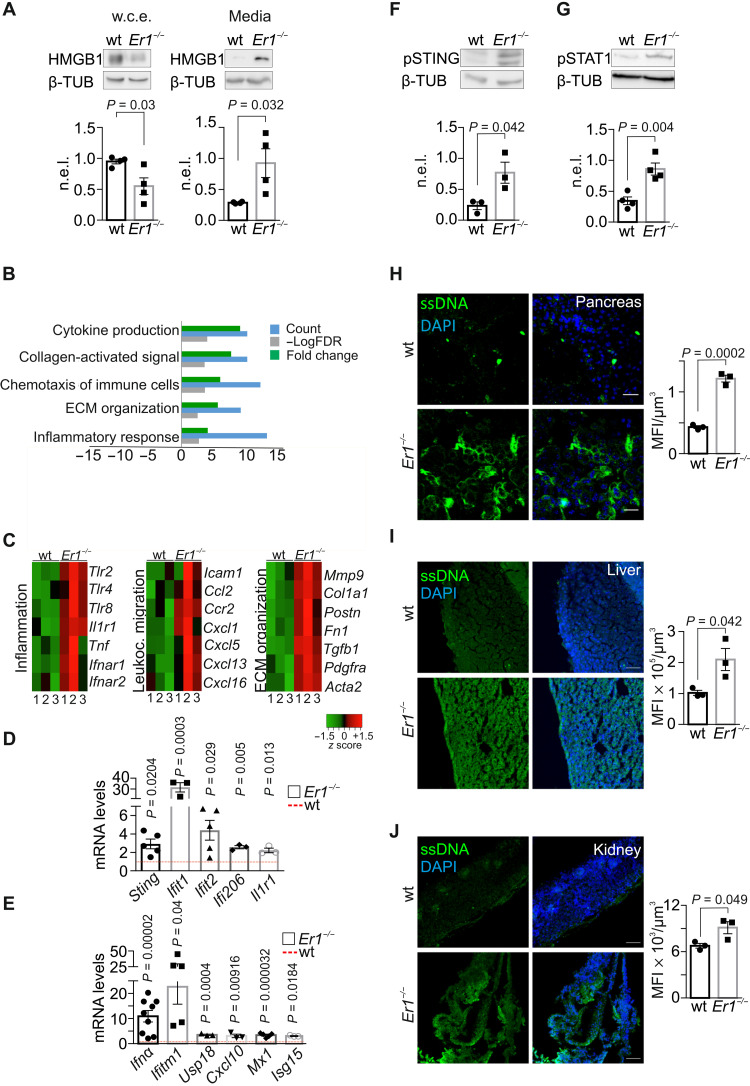
Fig. 3. Ercc1 deletion drives a viral-like response and cytoplasmic ssDNA accumulation.
(A) HMGB1 in whole-cell extracts (w.c.e.) and in the culture media of wt and Er1−/− PPCs (n = 4). (B) Overrepresented biological processes (Gene Ontology) of the differentially expressed genes in Er1−/− compared to wt pancreata [meta–false discovery rate (FDR) ≤ 0.01, fold change ≥ ±1.5, n = 3]. Processes with up-regulated genes (green) and down-regulated genes (red). (C) Heatmaps of representative genes associated with inflammation, leukocyte migration, and extracellular matrix (ECM) organization up-regulated in Er1−/− (1 to 3) compared to wt (1 to 3) pancreata. (D) mRNA levels of selected overrepresented genes in wt and Er1−/− pancreata. (E) mRNA levels of overrepresented Ifnα signature genes in wt and Er1−/− pancreata. (F) Phosphorylated STING (pSTING) and (G) phosphorylated STAT1 (pSTAT1) in whole-cell extracts of wt and Er1−/− pancreata (n = 3 to 4). (H) Immunostaining of ssDNA in wt and Er1−/− pancreas, (I) liver, and (J) kidney (n = 3). The graphs in (A), (F), and (G) represent the β-TUB n.e.l. of proteins in wt and Er1−/− pancreata and, in (H) to (J), the MFI per cubic micrometer of tissue. In (D) and (E), the red dashed lines represent the wt levels. Tissues and cells are derived from P15 mice. Scale bars, 40 μm. Error bars indicate SEM among n ≥ 3 replicates.

