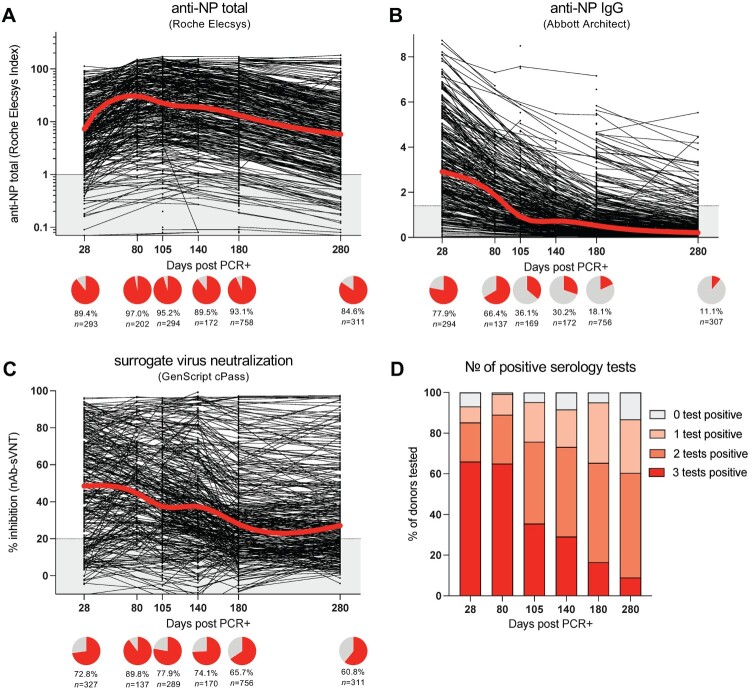
Figure 1.
Kinetics and decline of antibody responses to SARS-CoV-2 over nine months. Total anti-NP antibody titres were analysed using the Roche Elecsys test (a), anti-NP IgG antibody titres with the Abbott Architect (b), and virus neutralizing antibodies (sVNT) using the GenScript cPass test (c). All tested samples are shown as dots, the lines connect the samples of donors who were tested longitudinally. The red line indicates the median antibody titre index at the different timepoints post infection. The grey area shows the assay detection limit. The pie charts below the graph indicate the percentage of donors who tested positive for the antibody test at the different time points. (D) Summary of the percentage of donors who tested positive for none, 1, 2 or all 3 antibody tests performed at each timepoint post infection.

