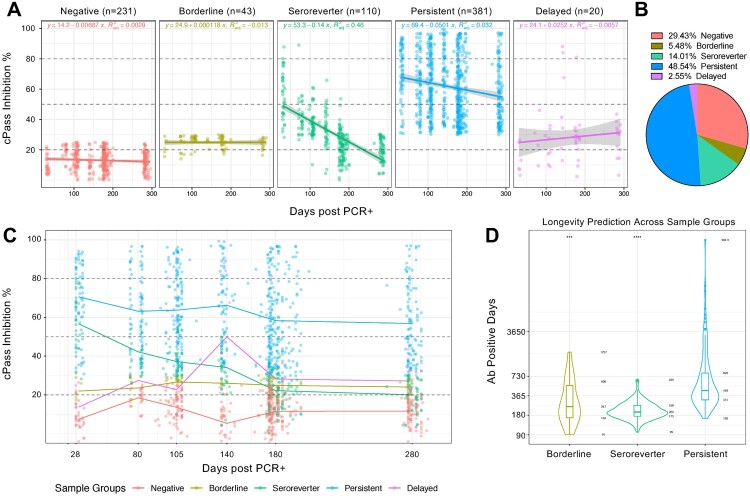
Figure 2.
Different SARS-CoV-2 neutralizing antibody profiles over nine months post infection. (a) Neutralizing antibody levels measured by percentage inhibition compared to negative control sample using cPass. Antibody levels were classified into five groups based on their kinetics and linear regression model for each group was applied. (b) The percentage of study participants in each group is as shown. (c) Group mean of the neutralizing antibody percentage is connected at days 28, 80, 105, 140, 180 and 280. Each point represents a single study participant. (d) Superimposed violin and box plots showing median, interquartile range, lowest and highest range of neutralizing antibody positive days in Borderline, Seroreverter and Persistent groups. p-value was calculated by Wilcoxon signed-rank test using the Persistent group as the reference group.

