Figure 3.
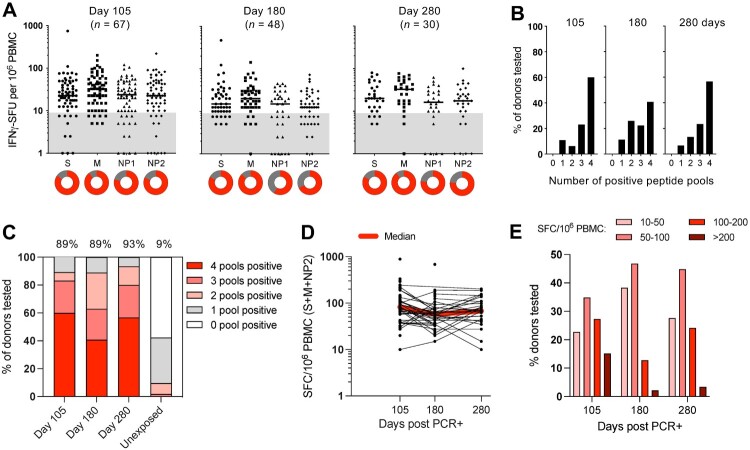
Kinetics of SARS-CoV-2-specific T cells over nine months post infection. (a) The frequencies of IFN-γ-spot forming cells (SFC) reactive to the peptide pools of Spike (S), Membrane (M) and Nucleoprotein (NP1 and NP2) are shown for donors tested at 105 (n = 67), 180 (n = 48) and 280 (n = 30) days post infection. Circles below represent the frequency of a positive (IFN-γ-SFC ≥10/106 PBMC) response (red) to the individual peptide pools. (b) Bar graphs show the percentage of donors reacting to the number of peptide pools tested. (c) Summary of the percentage of donors who tested positive for none, 1, 2, 3 or all 4 peptide pools tested at each timepoint post infection. Individuals who tested positive for at least 2 pools are were considered positive and the percentage of positive donors is indicated on the top of the graph. Cross-reactive T cell responses in unexposed donors (n = 51) are shown for comparison [18]. (d) The frequency of IFN-γ-SFC reactive to the peptide pools S, M and NP2 are shown. All tested samples are shown as dots, the lines connect the samples of donors who were tested longitudinally. The red line indicates the median T cell frequency at the different timepoints post infection. (e) The frequencies of donors with low (10–50 SFC/106 PBMC), medium (50–100 SFC/106 PBMC), high (100–200 SFC/106 PBMC), and very high (>200 SFC/106 PBMC) T cell responses are shown for the three timepoints post infection.

