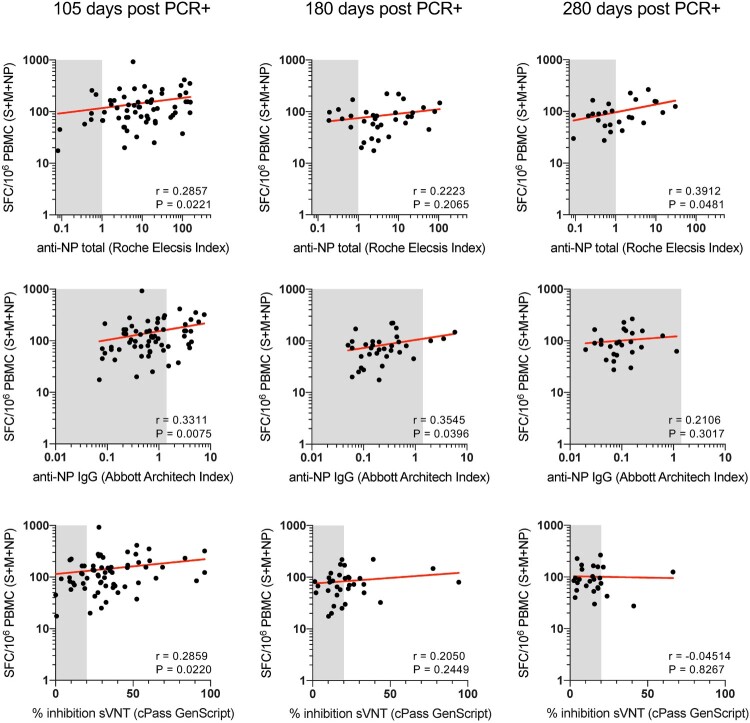
Figure 4.
Correlation of SARS-CoV-2-specific T cells with levels of total anti-NP IgG, anti-NP IgG and sVNT-nAb. The frequency of SARS-CoV-2-specific T cells, as quantified by IFN-γ ELISpot, reactive to all (Spike, M, NP) proteins tested were correlated with levels of total anti-NP (upper panels), levels of anti-NP-IgG (middle panels) and levels of sVNT-nAb (lower panels) at 105, 180 and 280 days post infection. Spearman correlations.

