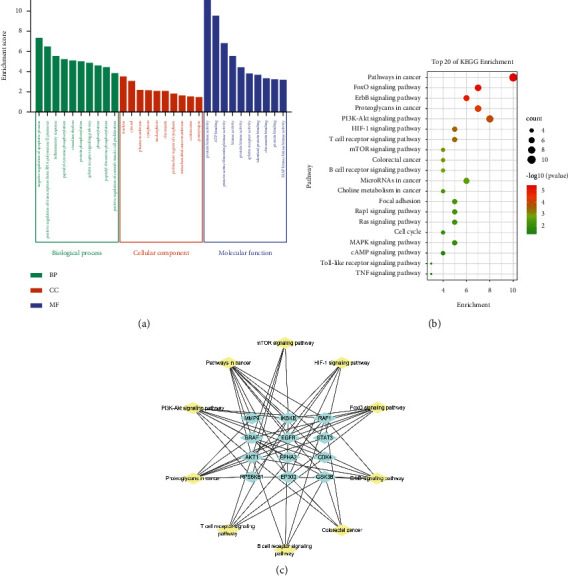
Figure 5.

(a) GO enrichment analysis. The top 10 biological processes, the top 10 cellular components, and the top 10 molecular functions. (b) KEGG enrichment analysis; the top 20 KEGG pathways. The color scales indicate the different thresholds for the p values, and the sizes of the dots represent the number of genes corresponding to each term. (c) Pathways-targets network.
