
Figure 6.
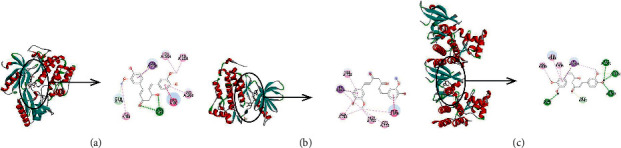
Three-dimensional and two-dimensional representation of the interaction between curcumin and key targets. (a) AKT1; (b) EGFR; (c) STAT3.
Official websites use .gov
A
.gov website belongs to an official
government organization in the United States.
Secure .gov websites use HTTPS
A lock (
) or https:// means you've safely
connected to the .gov website. Share sensitive
information only on official, secure websites.
Three-dimensional and two-dimensional representation of the interaction between curcumin and key targets. (a) AKT1; (b) EGFR; (c) STAT3.