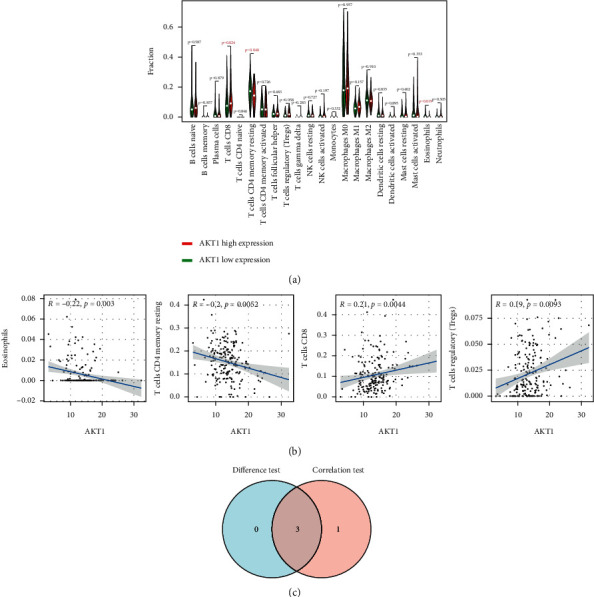
Figure 8.

Correlation between TICs and AKT1 expression. (a) Violin figure shows the proportional differentiation of 22 immune cells relative to the expression level of AKT1 in CRC tissue, and the significance was tested by the Wilcoxon rank-sum method. (b) Scatter figure shows the correlation between TICs and AKT1 expression (P < 0.05). The blue line of each figure fitted the linear model between the proportional orientation of immune cells and AKT1 expression. Pearson's coefficient was used for the correlation test. (c) Venn figure shows three TICs related to AKT1 expression, which were determined by the difference test of violin figure and correlation test of scatter figure, respectively.
