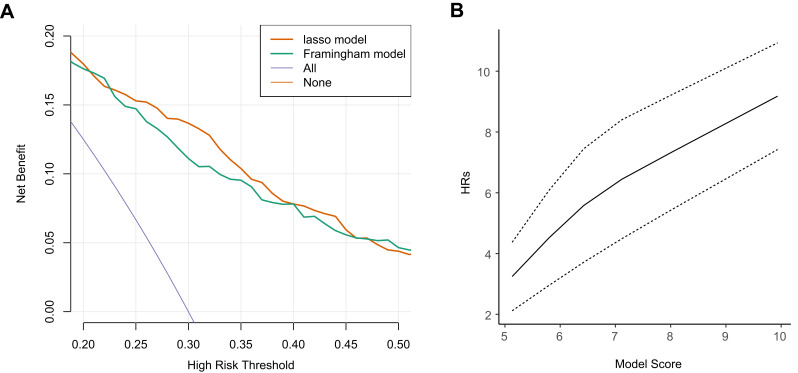
Figure 4.
Evaluation of the models. (A) Decision curve analysis of the two-candidate model. The y-axis represents the net benefit. Model 1 was built with LASSO-selected features; Model 2 is the Framingham classic feature model. (B) Linear and positive association between the model total score and the risk of incident CVD events using restricted cubic spline regression (for nonlinearity, P = 0.617).

