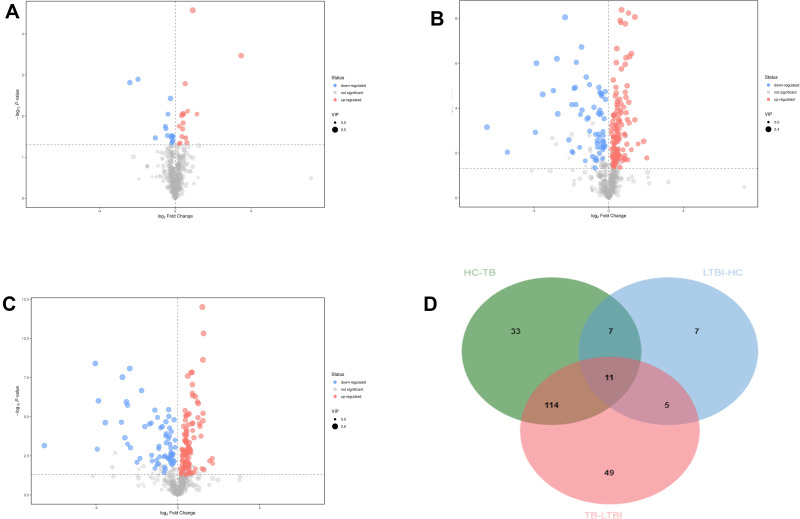
Figure 3.
Volcanic map of differential metabolites. For the LTBI/HC group (A) and LTBI/TB (B) and TB/HC group (C). The abscissa represented the fold change of the group compared to each substance (take the base 2 logarithm), the ordinate represented the P-value (take the base 10 logarithm), and the scatter size represented the VIP value of the OPLS-DA model. The larger the scattering, the larger the VIP value. The scatter color represented the final screening result. Significantly up-regulated metabolites are shown in red (FC ≥1, P < 0.05), significantly down-regulated metabolites are shown in blue (FC ≤-1, P < 0.05), and non-significant differential metabolites are shown in gray. (D) The Venn diagrams show the overlap between different health statuses for metabolites with significant abundance differences (VIP ≥1 and P < 0.05) between LTBI/HC group, LTBI/TB, and TB/HC group.

