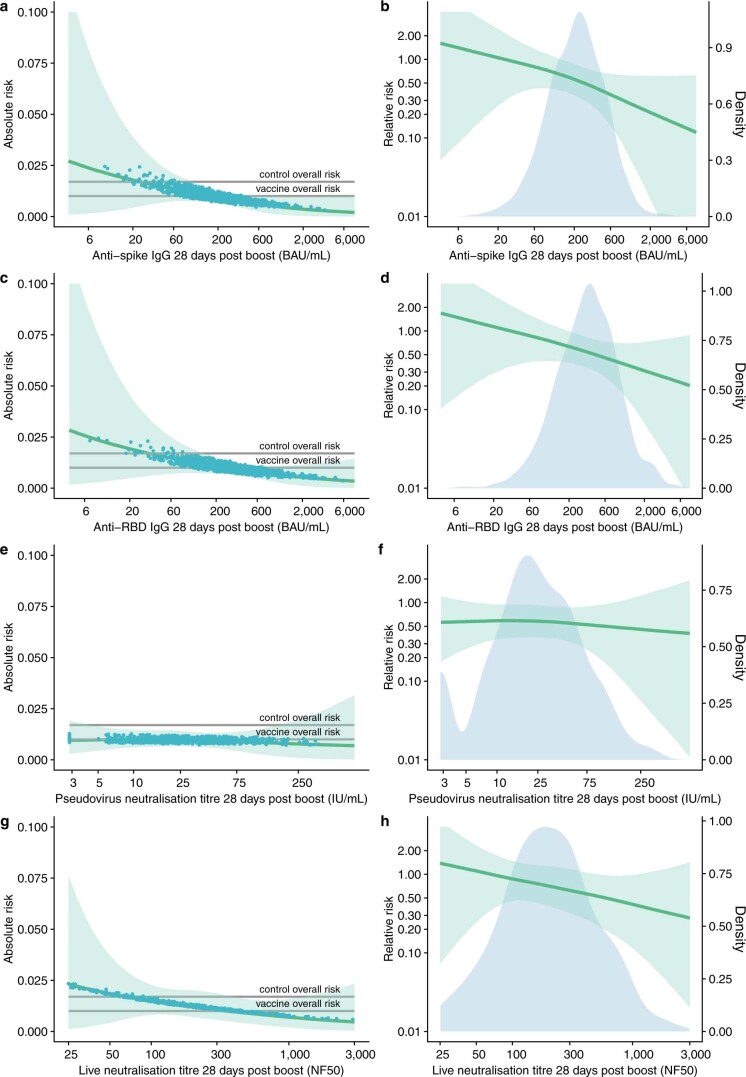
Extended Data Fig. 5. Sensitivity analysis showing absolute and relative risk of asymptomatic SARS-CoV-2 infection as a function of immune markers measured at 28 days post second dose excluding cases with low viral load (Ct ≥ 30).
a, c, e, g: Grey horizontal lines show the overall risk of primary symptomatic COVID-19 in the control group (MenACWY) and vaccine groups (ChAdOx1 nCoV-19). Blue dots show the absolute risk predicted from the model across the range of antibody values included in the analysis, adjusting for baseline exposure risk to SARS-CoV-2 infection. Green shaded areas show the confidence interval around the predicted mean probability (green line). b, d, f, h: Blue shaded areas represent the immune marker density distribution. Green lines show the relative risk of infection among vaccine recipients compared to the MenACWY control arm participants. The green lines are the median relative risk obtained from 10,000 bootstrap samples. Green shaded areas are 95% bootstrapped confidence intervals for the relative risk.

