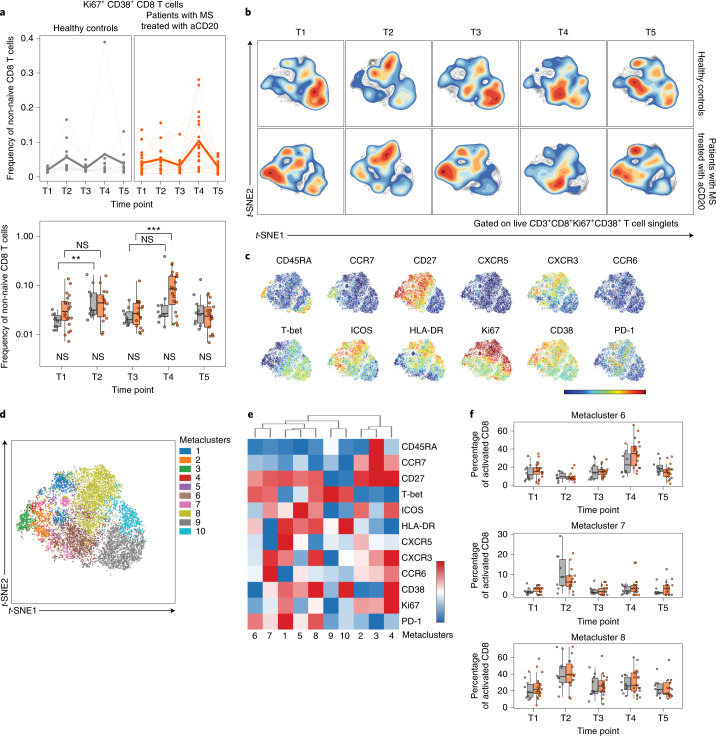
Fig. 4. SARS-CoV-2 mRNA vaccination results in robust CD8 T cell activation in healthy controls and patients with MS treated with aCD20.
a, Frequency of activated Ki67+CD38+ CD8 T cells of total non-naive CD8 T cells. Top: Individuals (points) and the mean (thicker line) are shown for each group. Bottom: Tukey box plots (median, Q1 and Q3 quartiles) for each time point and group are depicted. An unpaired, two-tailed Wilcoxon test was used to compare the two groups at each time point (shown under the box plots) or the groups between time points indicated (shown above the box plots). b, The opt-SNE projections of concatenated cytometry data for activated Ki67+CD38+ CD8 T cells for each time point and group combination are shown. c, Surface expression intensity of the indicated markers projected on the opt-SNE 2D map generated with all samples in b (color scale: MFI expression of each individual marker in a log scale). d, FlowSOM metaclusters were created using activated Ki67+CD38+ CD8 T cells concatenated from all samples and projected onto the opt-SNE map. e, Surface expression intensity heatmap of the markers indicated for each of the ten FlowSOM metaclusters in d (color scale: row-adjusted z-score expression for each individual marker). f, The abundance of metaclusters 6, 7 and 8 as the percentage of activated Ki67+CD38+ CD8 T cells is shown for healthy controls and patients with MS treated with aCD20. Unpaired, two-tailed Wilcoxon test P values are shown when P < 0.05 between groups. Gray, healthy controls (n = 10); orange: patients with MS treated with aCD20 (n = 20). *P < 0.05, **P < 0.01, ***P < 0.001.

